Click the thumbnail below to watch a walkthough of setting the operator up on AKS.
- An Azure Subscription (e.g. Free or Student account)
- Azure CLI with Azure Bicep installed
- Git CLI
kubectlCLI- Helm CLI
- Bash shell (e.g. macOS, Linux, Windows Subsystem for Linux (WSL), Multipass, Azure Cloud Shell, GitHub Codespaces, etc)
- OPTIONAL: Terraform CLI
If you do not have all the tools listed above, you can launch the GitHub Codespaces environment which has all the tools pre-installed.
Use Git CLI to clone this repo and drop into the directory
git clone https://github.com/Azure/carbon-aware-keda-operator.git
cd carbon-aware-keda-operatorYou have the option to deploy Azure resources using Azure CLI or Terraform. Depending on which option you choose, click the appropriate heading to expand instructions for each.
Regardless of the option you choose, you will need to login to Azure using the
az logincommand before you begin
Azure CLI
Create a resource group where Azure Cache for Redis and Azure Kubernetes Service will be deployed into
RAND=$RANDOM
RESOURCE_GROUP=rg-carbonaware-demo-$RAND
LOCATION=westeurope
CLUSTER_NAME=carbonaware-demo-$RAND

az group create \
  --name $RESOURCE_GROUP \
  --location $LOCATION
Redis which will be used to store a list of random words
This service can take 15-20 minutes to provision
REDIS_NAME=carbonaware-demo-$RAND

az redis create \
  --location $LOCATION \
  --name $REDIS_NAME \
  --resource-group $RESOURCE_GROUP \
  --sku Basic \
  --vm-size c0 \
  --enable-non-ssl-port

REDIS_HOST=$(az redis show -n $REDIS_NAME -g $RESOURCE_GROUP -o tsv --query "hostName")
REDIS_KEY=$(az redis list-keys --name $REDIS_NAME --resource-group $RESOURCE_GROUP -o tsv --query "primaryKey")
Azure Kubernetes Service is where we'll deploy and test this operator
az aks create \
 --resource-group $RESOURCE_GROUP \
 --name $CLUSTER_NAME \
 --node-count 1 \
 --node-vm-size Standard_DS3_v2 \
 --generate-ssh-keys \
 --node-osdisk-type Ephemeral \
 --enable-cluster-autoscaler \
 --min-count 1 \
 --max-count 10
This service can take 7-10 minutes to provision
Terraform
This repo includes a sample terraform file to deploy Azure Cache for Redis and Azure Kubernetes Service with the following commands
# drop into proper directory
cd hack/azure/terraform

# initialize terraform plugins
terraform init

# deploy resources
terraform apply

# set variables to connect to aks cluster
export RESOURCE_GROUP=$(terraform output -raw rg_name)
export LOCATION=$(terraform output -raw rg_location)
export CLUSTER_NAME=$(terraform output -raw aks_name)

# set variables to connect to redis
export REDIS_HOST=$(terraform output -raw redis_hostname)
export REDIS_KEY=$(terraform output -raw redis_password)

# get back to repository root
cd ../../../
This deployment can take 15-20 minutes to provision.
Retrieve the .kube/config file.
az aks get-credentials \
 --resource-group $RESOURCE_GROUP \
 --name $CLUSTER_NAME
Test your connectivity to the AKS cluster.
kubectl cluster-infoAs the name suggest, KEDA is a requirement for this operator. A sample manifest is available in this repo to install KEDA v2.10.0.
kubectl apply -f hack/keda/keda-2.10.0.yaml

# wait for external metrics
kubectl wait --for=condition=Available --timeout=600s apiservice v1beta1.external.metrics.k8s.ioThe sample workload included in this repo simulates a low-priority job that processes items off a Redis list.
Start by adding items to the Redis list.
kubectl run addwords \
  --image=ghcr.io/pauldotyu/simple-redis-pusher:latest \
  --env="REDIS_HOST=${REDIS_HOST}" \
  --env="REDIS_PORT=6379" \
  --env="REDIS_LIST=words" \
  --env="REDIS_KEY=${REDIS_KEY}" \
  --env="ITEM_COUNT=10000" \
  --restart=Never

# wait until the pod status shows completed
kubectl get po addwords -w
Next, deploy the word-processor app that will process items off the Redis list.
kubectl apply -f - <<EOF
apiVersion: apps/v1
kind: Deployment
metadata:
  name: word-processor
spec:
  replicas: 1
  selector:
    matchLabels:
      app: word-processor
  template:
    metadata:
      labels:
        app: word-processor
    spec:
      containers:
        - image: mcr.microsoft.com/mslearn/samples/redis-client:latest
          name: word-processor
          resources:
            requests:
              cpu: 100m
              memory: 128Mi
            limits:
              cpu: 100m
              memory: 128Mi
          env:
            - name: REDIS_HOST
              value: ${REDIS_HOST}
            - name: REDIS_PORT
              value: "6379"
            - name: REDIS_LIST
              value: "words"
            - name: REDIS_KEY
              value: ${REDIS_KEY}
EOF

# note the number of replicas that are ready
kubectl get deploy word-processor
Finally, scale the word-processor app using KEDA's Redis trigger.
kubectl apply -f - <<EOF
apiVersion: keda.sh/v1alpha1
kind: ScaledObject
metadata:
  name: word-processor-scaler
spec:
  scaleTargetRef:
    apiVersion: apps/v1                             # Optional. Default: apps/v1
    kind: deployment                                # Optional. Default: Deployment
    name: word-processor                            # Mandatory. Must be in the same namespace as the ScaledObject
    envSourceContainerName: word-processor          # Optional. Default: .spec.template.spec.containers[0]
  pollingInterval: 30                               # Optional. Default: 30 seconds
  cooldownPeriod:  120                              # Optional. Default: 300 seconds
  minReplicaCount: 0                                # Optional. Default: 0
  maxReplicaCount: 100                              # Optional. Default: 100
  advanced:                                         # Optional. Section to specify advanced options
    restoreToOriginalReplicaCount: false            # Optional. Default: false
    horizontalPodAutoscalerConfig:                  # Optional. Section to specify HPA related options
      behavior:                                     # Optional. Use to modify HPA's scaling behavior
        scaleDown:
          stabilizationWindowSeconds: 300
          policies:
          - type: Percent
            value: 100
            periodSeconds: 15
  triggers:
  - type: redis
    metadata:
      hostFromEnv: REDIS_HOST
      portFromEnv: REDIS_PORT
      passwordFromEnv: REDIS_KEY
      listName: words
      listLength: "500"
      enableTLS: "false"
      databaseIndex: "0"
EOF

# wait a few seconds and note the number of replicas that are ready now
kubectl get deploy word-processor -wTo test with real data from the Carbon Aware SDK, head over to this repo and follow the instructions in the README.md to install the operator into the AKS cluster.
IMPORTANT: You must have WattTime API credentials to use this operator
If you do not have WattTime API credentials you can skip this step and still test this operator using mock carbon intensity data
Using Helm, install the Carbon Intensity Exporter Operator into the AKS cluster.
export REGION=westus
export WT_USERNAME=<YOUR_USERNAME>
export WT_PASSWORD=<YOUR_PASSWORD>

helm install carbon-intensity-exporter oci://ghcr.io/azure/kubernetes-carbon-intensity-exporter/charts/carbon-intensity-exporter \
  --version v0.3.0 \
  --set carbonDataExporter.region=$REGION \
  --set wattTime.username=$WT_USERNAME \
  --set wattTime.password=$WT_PASSWORD
Verify carbon intensity data is in place.
# ensure the status of the carbon intensity exporter operator pod is running
kubectl get po -n kube-system -l app.kubernetes.io/name=carbon-intensity-exporter

# get configmap data
kubectl get cm -n kube-system carbon-intensity -o jsonpath='{.data}' | jq
You can view the carbon intensity values with the following command.
# get carbon intensity binary data
kubectl get cm -n kube-system carbon-intensity -o jsonpath='{.binaryData.data}' | base64 --decode | jqCurrently KEDA is scaling your workload as needed and will scale up to a maximum of 100 replicas (KEDA's default) if needed. We will now add carbon awareness to it, so that it's maximum replicas is capped based on carbon intensity.
Install the latest version of the operator.
version=$(git describe --abbrev=0 --tags)
kubectl apply -f "https://github.com/Azure/carbon-aware-keda-operator/releases/download/${version}/carbonawarekedascaler-${version}.yaml"
Latest release versions can be found here 👉 https://github.com/Azure/carbon-aware-keda-operator/releases/
With the operator installed, we can now deploy a custom resource called CarbonAwareKedaScaler to set the max replicas KEDA can scale up to based on carbon intensity.
kubectl apply -f - <<EOF
apiVersion: carbonaware.kubernetes.azure.com/v1alpha1
kind: CarbonAwareKedaScaler
metadata:
  labels:
    app.kubernetes.io/name: carbonawarekedascaler
    app.kubernetes.io/instance: carbonawarekedascaler-sample
    app.kubernetes.io/part-of: carbon-aware-keda-operator
    app.kubernetes.io/managed-by: kustomize
    app.kubernetes.io/created-by: carbon-aware-keda-operator
  name: carbon-aware-word-processor-scaler
spec:
  kedaTarget: scaledobjects.keda.sh
  kedaTargetRef:
    name: word-processor-scaler
    namespace: default
  carbonIntensityForecastDataSource:       # carbon intensity forecast data source
    mockCarbonForecast: false              # [OPTIONAL] use mock carbon forecast data
    localConfigMap:                        # [OPTIONAL] use configmap for carbon forecast data
      name: carbon-intensity
      namespace: kube-system
      key: data
  maxReplicasByCarbonIntensity:            # array of carbon intensity values in ascending order; each threshold value represents the upper limit and previous entry represents lower limit
    - carbonIntensityThreshold: 437        # when carbon intensity is 437 or below
      maxReplicas: 110                     # do more
    - carbonIntensityThreshold: 504        # when carbon intensity is >437 and <=504
      maxReplicas: 60
    - carbonIntensityThreshold: 571        # when carbon intensity is >504 and <=571 (and beyond)
      maxReplicas: 10                      # do less
  ecoModeOff:                              # [OPTIONAL] settings to override carbon awareness; can override based on high intensity duration or schedules
    maxReplicas: 100                       # when carbon awareness is disabled, use this value
    carbonIntensityDuration:               # [OPTIONAL] disable carbon awareness when carbon intensity is high for this length of time
      carbonIntensityThreshold: 555        # when carbon intensity is equal to or above this value, consider it high
      overrideEcoAfterDurationInMins: 45   # if carbon intensity is high for this many hours disable ecomode
    customSchedule:                        # [OPTIONAL] disable carbon awareness during specified time periods
      - startTime: "2023-04-28T16:45:00Z"  # start time in UTC
        endTime: "2023-04-28T17:00:59Z"    # end time in UTC
    recurringSchedule:                     # [OPTIONAL] disable carbon awareness during specified recurring time periods
      - "* 23 * * 1-5"                     # disable every weekday from 11pm to 12am UTC
EOF
IMPORTANT: If the Carbon Intensity Exporter Operator was NOT installed from the step above, make sure
mockCarbonForecastis set totrueto use mock data.
Check the status of the custom resource.
kubectl describe carbonawarekedascalers.carbonaware.kubernetes.azure.com carbon-aware-word-processor-scalerInspect operator logs.
kubectl logs -n carbon-aware-keda-operator-system -l control-plane=controller-managerInspecting operator logs and status/events of the custom resource is great. What's better? Visualizing the data in Grafana!
Each time the operator reconciles, it writes custom metrics (e.g., Carbon Intensity, Max Replicas, and Max Replicas) to the /metrics endpoint so that Prometheus can scape the data and visualized using Grafana.
This repo include manifests to deploy kube-prometheus into the cluster which is configured to scrape from the operator's namespace: carbon-aware-keda-operator-system.
Install the Prometheus operator.
kubectl apply --server-side -f hack/prometheus/manifests/setup
kubectl wait --for condition=Established --all CustomResourceDefinition --namespace=monitoring
Deploy ServiceMonitor into the cluster.
kubectl apply -f - <<EOF
apiVersion: monitoring.coreos.com/v1
kind: ServiceMonitor
metadata:
  labels:
    app.kubernetes.io/component: metrics
    app.kubernetes.io/created-by: carbon-aware-keda-operator
    app.kubernetes.io/instance: controller-manager-metrics-monitor
    app.kubernetes.io/managed-by: kustomize
    app.kubernetes.io/name: servicemonitor
    app.kubernetes.io/part-of: carbon-aware-keda-operator
    control-plane: controller-manager
  name: carbon-aware-keda-operator-controller-manager-metrics-monitor
  namespace: carbon-aware-keda-operator-system
spec:
  endpoints:
  - bearerTokenFile: /var/run/secrets/kubernetes.io/serviceaccount/token
    path: /metrics
    port: https
    scheme: https
    tlsConfig:
      insecureSkipVerify: true
  selector:
    matchLabels:
      control-plane: controller-manager
EOF
Deploy the Prometheus + Grafana stack.
kubectl apply -f hack/prometheus/manifests/

# wait for all the monitoring pods to be running
kubectl get po -n monitoring -w
Assign the carbon-aware-keda-operator-metrics-reader cluster role to the Prometheus operator. This allows the Prometheus operator to scrape from the Carbon Aware KEDA Operator's namespace.
kubectl create clusterrolebinding carbon-aware-keda-operator-prometheus-rolebinding \
  --clusterrole=carbon-aware-keda-operator-metrics-reader \
  --serviceaccount=default:prometheus-operator
Grafana has been deployed as a service in the cluster; however, it is only accessible via ClusterIP. You can port-forward the service to access it from your local machine or you can update the service type to LoadBalancer so that you can reach it from outside the cluster.
kubectl patch svc grafana -n monitoring -p '{"spec": {"type": "LoadBalancer"}}'After a few minutes, Azure Load Balancer will provisioned and assigned a public IP. Browse to the website when it is fully provisioned.
echo "http://$(kubectl get svc grafana -n monitoring -o jsonpath='{.status.loadBalancer.ingress[0].ip}'):3000/"In your web browser, navigate to the Grafana URL which was obtained in the command above and log in using the default username admin with default password admin. You will be prompted to create a new password.
Download the sample dashboard here.
Expand the Dashboards menu item and click the + Import button.

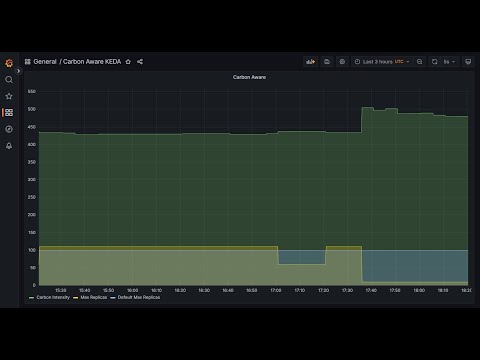
Upload the Carbon Aware KEDA-Dashboard.json file and select prometheus as the data source then click Import.

You will be able to view the default max replicas, and the max replicas ceiling being raised and lowered over time based on the carbon intensity rating.

When you are done testing, delete the resources using the following command.
az group delete --resource-group $RESOURCE_GROUPIf you deployed the Azure resources using Terraform, you can run this command instead.
cd hack/azure/terraform
terraform destroy