


In this project, I try to identify how hot a Formula 1 tire is using a thermal camera.
Thermographic cameras detect radiation in the long-infrared range of the electromagnetic spectrum. Any object with a temperature above absolute zero can emit infrared radiation and we can see it without visible lighting using a thermographic camera. Using this technique, we can detect equipment anomalies before they break.
I took a video of a lap given by the driver Paul Di Resta in Monza (link below). The team placed a thermographic camera to monitor how his tires are in good temperature to get more grip.
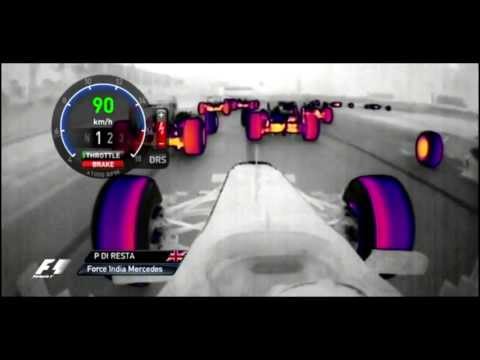
The hotter the tire, the better its grip. So, based on the color, we can try to define how the tires are warmer. I defined two regions of interest in tires and tracked these ROIs. I calculated histograms on each frame to define how hot or cold the tires are. You can see it in the image below.

OpenCV - Library to help develop computer vision applications. Numpy - The fundamental package for scientific computing with Python.