- Review 2.3 Higher order C-techs
- Fluorescent In Situ Hybridization (FISH)
- Data-Driven Approaches
- De Novo Modelling
- FISH
- Computational Modelling (in general)
- Data-Driven Approaches (in specific)
- De Novo Modelling (in specific)
The goal of the Four-Dimensional Nucleosome (4DN) program is to study the three-dimensional organization of the nucleus in space and time (the fourth dimension) . The nucleus of a cell contains DNA, the genetic “blueprint” that encodes all of the genes a living organism uses to produce proteins needed to carry out life-sustaining cellular functions. Understanding the cell's nuclear organization can lead to a better understanding of the development of different diseases, such as cancer, autoimmune diseases, and more. It is for this reason that the 4DN program shows such promise in advancing cancer therapies, infectious disease prevention and many other studies. Watch this video to learn how 4DN aims to improve public health! [1]
logo of 4DN[1]**

Three components of The 4D Nucleome Project[3]
Model buidling methods are used to integrate, analyse ,and model datasets obtained with these technologies to obtain a comprehensive view of the 4D nucleome. There are at least two major computational approaches for modelling genome architecture on the basis of experimental data: data-driven and de novo approaches. Data-driven approaches directly use experimental data (Hi-C, imaging, and so on) to produce an ensemble of conformations that best match an experimentally observed set of contact probabilities and distances. De novo modelling, on the other hand, produces ensembles of conformations that result from known or hypothesized physical or biological processes, and tests whether these ensembles are consistent with features of experimental contact frequency maps and imaging data.
Experimental mapping approaches are used to measure a range of aspects of the spatial organization of the genome, including chromatin loops, domains, nuclear bodies and so on. Since the 4DN project seeks to provide information across four dimensions, it is naturally preceded by data in the third dimension. Imaging platforms are developed to enable visualizing the dynamics, interactions, and structural organization of the nucleus at unprecedented temporal and spatial resolutions. Each of these approaches has unique and complementary abilities for the analysis of different aspects of genome organization. In particular, platforms enabling live-cell imaging allow the dynamics of select chromatin regions and nuclear features to be studied in real time. [3]
Review 2.3 Higher Order C-techs
Below is a summarized rundown of the pipelines used to obtain the spatial organization of the genome using Hi-C methods:

Comparison among 3C and its derived methods: An overview of the 3C-derived methods that are discussed is given. The horizontal panel shows the cross-linking, digestion, and ligation steps common to all of the “C” methods. The vertical panels indicate the steps that are specific to separate methods. [2]
| Method Name | Scope | Application |
|---|---|---|
| 3C | One vs One: Compares a single genomic locus to another single genetic locus | Testing candidate promoter-enhancer regions |
| 4C | One vs All: Compares a single genetic locus to the entire genome | Finding the “partner region” of a loci by amplifying the region of interest |
| 5C | Many vs Many: Compares all loci within a set of restriction fragments | Analyzing complex interactions between entire regions of interest |
| Hi-C | All vs All: Compares the entire genome against itself | Screening for tumors or analyzing cell lines |
| ChIA-PET | All* vs All*: Compares enriched regions of the entire ge5Cnome | Analyzing complex interactions between protein-specific regions of interest |
For a more in-depth explanation of each of these higher-C techniques, please refer to 2.3 Higher Order C-techs.
One of the most promising sources of 3-Dimensional data for 4D modelling is data derived from the method known as FISH. FISH is incredibly useful as a technique that facilitates the analysis of genomic data in a spatial-temporal context since it allows the dynamic visualization of target DNA segments within chromosomes [4]. The way that FISH achieves this is by using the following pipeline[5]:
- Target DNA for the collected sample is defined. This would be the specific sequence of base pairs being searched for
- A “probe” for the DNA is synthesized. This probe is a complementary strand of the target with a fluorescent tag chemically attached to it
- The collected sample of DNA is denatured in order to allow for binding of the probes to the target DNA
- The probes are introduced to the sample and hybridization occurs between the two
- The resulting hybrid is then analyzed using fluorescence microscopy to determine the spatial location of any target sequences located within the sample
Basic steps of fluorescence in situ hybridization[5]

FISH will be exploited to image genomic interactions over different spatial distances in different cell types and states. These imaging tools will have an important role in benchmarking, validating and complementing data obtained with genomic and proteomic mapping technologies. CRISPR–dCas9 FISH in live cells and other live-cell imaging approaches will be used to assay the dynamic behavior of particular chromatin regions and/or nuclear structures in real time. [3]

Modelling the 4D Nucleome [3]
Data obtained with imaging and chromosome conformation capture-based assays can be used for building spatial and dynamic models of chromosomes using two main approaches. In the data-driven approach, experimental data are used directly to generate ensembles of conformations that reproduce the experimental observations. In the de novo approach, ensembles of conformations are built according to known or hypothesized physical or biological processes. Models are then selected based on their agreement with experimental data. [3]
An increasing amount of experimental evidence supports the idea of modifications of the genome on a spatial and temporal level during development and differentation of disease. The data driven approach offers a promising outlet for this data to be brought to fruition on an unprecedented scale. With the assitance of modern computational power, this untapped evidence can be explored in the form of psuedo-4D models that offer a view into chromatin dynamics. Below are two of the leading approaches of data driven modelling and their workflows:
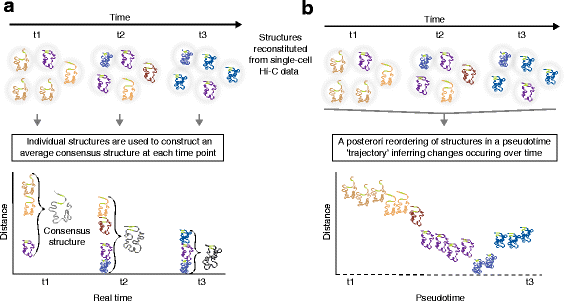
Reconstitutions of chromosome structures in a time-series analysis of three-dimensional (3D) genome conformation: consensus structures at each time-point versus reconstruction of structures through a pseudotime trajectory. [6]
a. 3D chromsome strucures derived from Hi-C data in single cells in a time series are a valuable and necessary input for constructing real-time conformation models and their variance. Here is a summary of this method's workflow:
- Structures determined by single cell Hi-C data are organized along a time line
- These structures are looked at by time of capture and are directly translated to an average consensus structure
- These consensus structures now serve as real-time analysis of genomic conformation across the surveyed cells, but they limit our understanding of dynamic topological changes occuring between data capture
b. In exchange for real-time analysis at the moment of data collection, insights into the dynamix and exciting changes to genome topology can be unlocked. Below is the workflow of the method shown in part b of the figure that allows for this level of insight:
- Structures are combined into a matrix with distance determined by time between data capture
- These structures are now aggregated and compared within the matrix to create a psuedo-timeline of dynamic topological change
- Rather than generating individual consensus structures, a fluid timeline of conformation changes is constructed and represented by one large evolving structure over an axis of psuedo-time
De novo modelling can be thought of as the spiritual successor to many years of work in the field of genome organization across different cell types' architecture. In an age where data is abundant and the capability of utilizing it becomes increasingly important, methods like de novo modelling that serve as the intersection of pre-existing research and new computational power are more relevant than ever. At its core, de novo modelling employs the use of prior knowledge or theories regarding physical and biological mechanisms to compute desired genetic models. Below is a description of a pipeline that best shows how de novo modelling combines multiple techniques and sources to create the feedback loop that is becoming increasingly integral to developing theories on genome organization:
- Experimentally obtained ChIP-seq data serves as the sole input and is converted to chromatin structural types by a neural network (a form of machine learning)
- The freshly computerd chromatin structural types are fed to a computational modelling program to produce an ensemble of 3D structures
- The structures produced by the modelling software are now compared against experimentally obtained contact maps to determined using Hi-C
This de novo modelling process will continue to improve its own computational inferences, and by extension, the theories its user employs to explain genomic organization.

Schematic illustration of the MEGABASE + MiChroM computational pipeline [9]
Throughout the course of this chapter, we have outlined three major approaches: FISH, Data-Driven Modelling, and De Novo Modelling. Each of these methods have their respective strengths and weaknesses, but it can be hard to determine how they affect the decision of which one to use. Below is an outline of information concerning these methods' use cases.
FISH is an increasingly valuable resource for data concerning the 4D Nucleome since it allows for the dynamic viewing of genomic conformation changes in situ.
- Advantages:
- The guess work of what changes are taking place, and when, is removed; allowing the observer to make accurate and detailed observations of the target sequence
- Unlike Hi-C dependent modelling methods, source material is preserved so that observations can continue to be made without fear of destroying or corrupting a sample of interest
- Disadvantages:
- Since FISH relies on microscopy of a target sequence, it is not possible to observe targets on a grand scale
- Without the ability to view large scale genomic targets, theories derived from FISH may not be as widely applicable as originally thought
Computational models like the ones described below offer exciting opportunities in the world of genomics data processing, and they will continue to become increasingly necessary and relevant. [8]
- Advantages:
- Since the models produced by this method are done through computational methods, they can be generated at a large and efficient scale unlike real-time analysis methods
- Disadvantages:
- Hi-C maps, a benchmark for accurate modelling, are not representative of single conformations. They are produced from a collection of conformations which makes direct comparison to de novo’s single conformation models very difficult.
- Due to the way that Hi-C probes a particular part of the pairwise distance distribution to focus on small distances, it’s contact probabilities cannot be translated to spatial distances. This means that imaging, another modelling benchmark, is not completely reliable.
- There is a lack of consensus regarding how to compare spatial models to Hi-C data. There are a range of features to consider beyond simple correlation. Without a standardized list of these features, there may be some discrepancy in training the models.
Data-Driven modelling takes Hi-C data acquired through experimentation to the next level by transforming it into meangiful and varied orgnaizational models.
- Advantages:
- Since the pipeline only requires Hi-C data, this method of modelling allows quick and efficient model production
De Novo modelling makes the most of prior theories and concepts by deriving models from them and comparing said models to experimental data for verification.
- Advantages:
- Since this model makes use of several layers of information (prior knowledge, model generation, and experimental data) it is able to generate a more reliable and strong feedback look for optimization
Now that we’ve covered the main 4D modelling approaches, as well as their benefits and drawbacks, let’s go over how researchers have been applying these powerful techniques to make interesting discoveries. For example, in one publication from the 4DN project, geneticists studied the changes to a mouse genome during neural development.
To study the state of the genome over a specific period of time, the following workflow was used [10].
-
Cell Isolation and Purification for Hi-C: Cells are dissociated to release the cellular contents and fixated with formaldehyde in preparation for Hi-C.
-
Hi-C Library Preparation: The Hi-C protocol was executed on the prepared samples to map out chromatin interactions.
-
Strand-Specific Total RNA Library Preparation: The RNA-seq protocol was executed on the prepared samples to measure differential gene expression.
-
ChIP and Library Preparation: The ChIP-seq protocol was executed on the prepared samples to identify protein-binding sites.
-
Library QC and Sequencing: Before sequencing happens in any of the above steps, the library sizes were measured using qPCR.
-
Quantification and Statistical Analysis: The sequencing data, which is in the form of FASTQ files, is cleaned and aligned to a reference genome using tools, such as STAR (RNA-seq, ChIP-seq) and bowtie2 (Hi-C seq), then analyzed for protein-DNA/DNA-DNA interactions and differential levels of gene expression. In particular, the Hi-C data is used to generate multiple aspects of the 3D model, including the contact distances and contact probability matrix. Each of the Hi-C contacts are scored using a k-nearest-neighbors approach, then later aggregated using k-means clustering to generate a reasonably accurate model of the contact points.
-
Fluorescent In Situ Hybridization (FISH): The FISH protocol (as mentioned in an early section of this chapter) was executed to view the movement of FISH probes as it interacted with the chromatin.
From these models, the researchers of this study were able to generate high-resolution Hi-C maps and observe the genome contact points throughout neural development. They concluded that during differentiation of embryonic mouse stem cells into neural cells, the 3D chromatin interactions were being reorganized globally.
The 4DN program has generated a variety of tools and resources that allow scientists to continue learning about the importance of nuclear organization. Program deliverables found at the 4DN Portal include nearly 2000 datasets from hundreds of experiments, 52 software packages and 23 protocols and reagents for researchers to use. Despite its progress, tThere is still a need to deliver data and tools to the broader biomedical research community to address the role of nuclear organization in health and disease. A second stage of funding for the 4DN program will start in 2020 and will focus on five initiatives [1]:
- Study chromatin dynamics and function
- Data integration, modeling, and visualization
- Transition of research into primary cells, organoids, tissues, and eukaryotic model organisms
- A 4DN organizational hub
- A 4DN data coordination and integration center
Specifically, there are several challenges and promises of current modelling approaches[3]:
- Relationships between genome organization data can be complicated.
- Most current genomic methods yield data from ensembles of thousands to millions of cells, obscuring structural heterogeneity that exists among single cells.
- Most current models do not account for the fact that mammalian cells are diploid, that is, they do not distinguish or separately model homologous chromosomes, which will be particularly important for modelling based on single-cell data.
- Contemporary approaches for modelling genome architecture are typically static rather than dynamic, reflecting the static nature of available Hi-C data and the majority of imaging data.
- New data and future models should help to connect genome architecture and other aspects of genome function.
- 4DN web portal: https://www.4dnucleome.org/index.html
- de Wit E, de Laat W: A decade of 3C technologies: insights into nuclear organization. Genes Dev. 2012, 26 (1): 11-24. 10.1101/gad.179804.111.
- Dekker, J., Belmont, A., Guttman, M. et al. The 4D nucleome project. Nature 549, 219–226 (2017) doi:10.1038/nature23884
- Cremer M. et al. (2012) Multicolor 3D Fluorescence In Situ Hybridization for Imaging Interphase Chromosomes. In: Hancock R. (eds) The Nucleus. Methods in Molecular Biology, vol 463. Humana Press, Totowa, NJ
- Amann, R., Fuchs, B. Single-cell identification in microbial communities by improved fluorescence in situ hybridization techniques. Nat Rev Microbiol 6, 339–348 (2008) doi:10.1038/nrmicro1888
- Sekelja, M., Paulsen, J. & Collas, P. 4D nucleomes in single cells: what can computational modeling reveal about spatial chromatin conformation?. Genome Biol 17, 54 (2016) doi:10.1186/s13059-016-0923-2
- Ma W, Ay F, Lee C, Gulsoy G, Deng X, Cook S, et al. Fine-scale chromatin interaction maps reveal the cis-regulatory landscape of human lincRNA genes. Nat Methods. 2015;12:71–8.
- Imakaev MV, Fudenberg G, Mirny LA. Modeling chromosomes: Beyond pretty pictures. FEBS Lett. 2015 Oct 7;589(20 Pt A):3031-6. doi: 10.1016/j.febslet.2015.09.004. Epub 2015 Sep 10. PMID: 26364723; PMCID: PMC4722799.
- Michele Di Pierro, Ryan R. Cheng, Erez Lieberman Aiden, Peter G. Wolynes, José N. Onuchic, Epigenetic patterns encode genome architecture Proceedings of the National Academy of Sciences Nov 2017, 114 (46) 12126-12131; DOI: 10.1073/pnas.1714980114rra, François, Di Stefano, Marco, Spill, Yannick G., Cuartero, Yasmina, Goodstadt, Michael, Baù, Davide and Marti-Renom, Marc A. ( 2015), Restraint-based three-dimensional modeling of genomes and genomic domains, FEBS Letters, 589, doi: 10.1016/j.febslet.2015.05.012
- Serra, François, Di Stefano, Marco, Spill, Yannick G., Cuartero, Yasmina, Goodstadt, Michael, Baù, Davide and Marti-Renom, Marc A. ( 2015), Restraint-based three-dimensional modeling of genomes and genomic domains, FEBS Letters, 589, doi: 10.1016/j.febslet.2015.05.012