Visualizing the time board #6
Labels
Comments
|
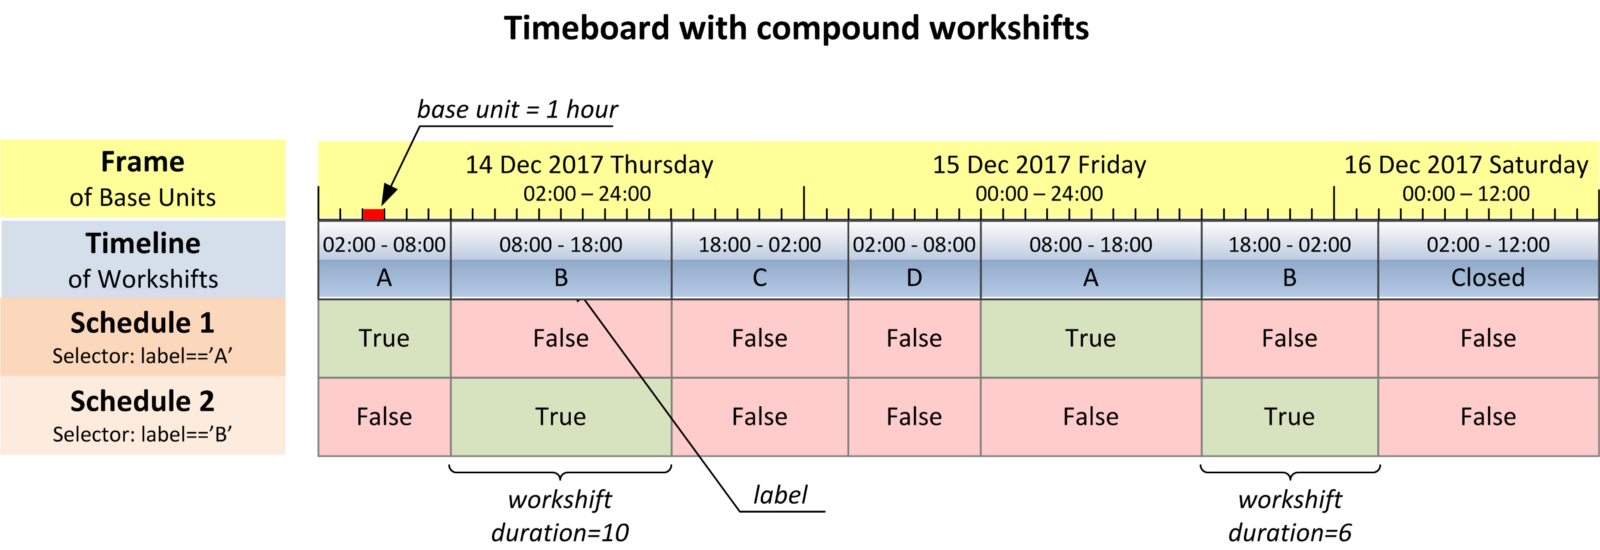
The pictures in the article were not generated by a code but drawn manually. Meaning, I don't have a tool for vizualization of timeboards. This is an interesting feature request. Hopefully, in some way it can be done with matplotlib but so far I haven't had time to think about it properly. |
|
You could use plotly Gantt charts for interactive visualization: import timeboard as tb
import pandas as pd
import plotly.figure_factory as ff
clnd = tb.Timeboard(base_unit_freq='8H',
start='01 Oct 2017 02:00', end='05 Oct 2017 01:59',
layout=['A', 'B', 'C', 'D'])
ivl = clnd(('2017-10-02', '2017-10-04')) # interval
task = [ws.label for ws in ivl.workshifts()]
start = [ws.start_time for ws in ivl.workshifts()]
finish = [ws.end_time for ws in ivl.workshifts()]
df = pd.DataFrame(list(zip(task, start, finish)),
columns =['Task', 'Start', 'Finish'])
fig = ff.create_gantt(df,
group_tasks=True,
index_col='Task',
showgrid_x = True,
showgrid_y = True,
show_colorbar = True)
x_dtick_hours = 4
fig.update_xaxes(tick0 = start[0],
dtick = x_dtick_hours * 60 * 60 * 1000, # hours to milliseconds
)
fig.show()
|

Sign up for free
to join this conversation on GitHub.
Already have an account?
Sign in to comment
Hello, thank you for sharing this. This is great. Was wondering if there is a way to visualize a timeboard like how you do have in the article on free code camp. If so, could you please share how we would visualize the schedule/time board of one of the generic calenders?
Thank you
The text was updated successfully, but these errors were encountered: