We’ve all had bar graphs and line graphs showing the status of our systems. Data points are mapped to business events or just something completely irrelevant. These visualizations tend to look static, technical and BOOORING.
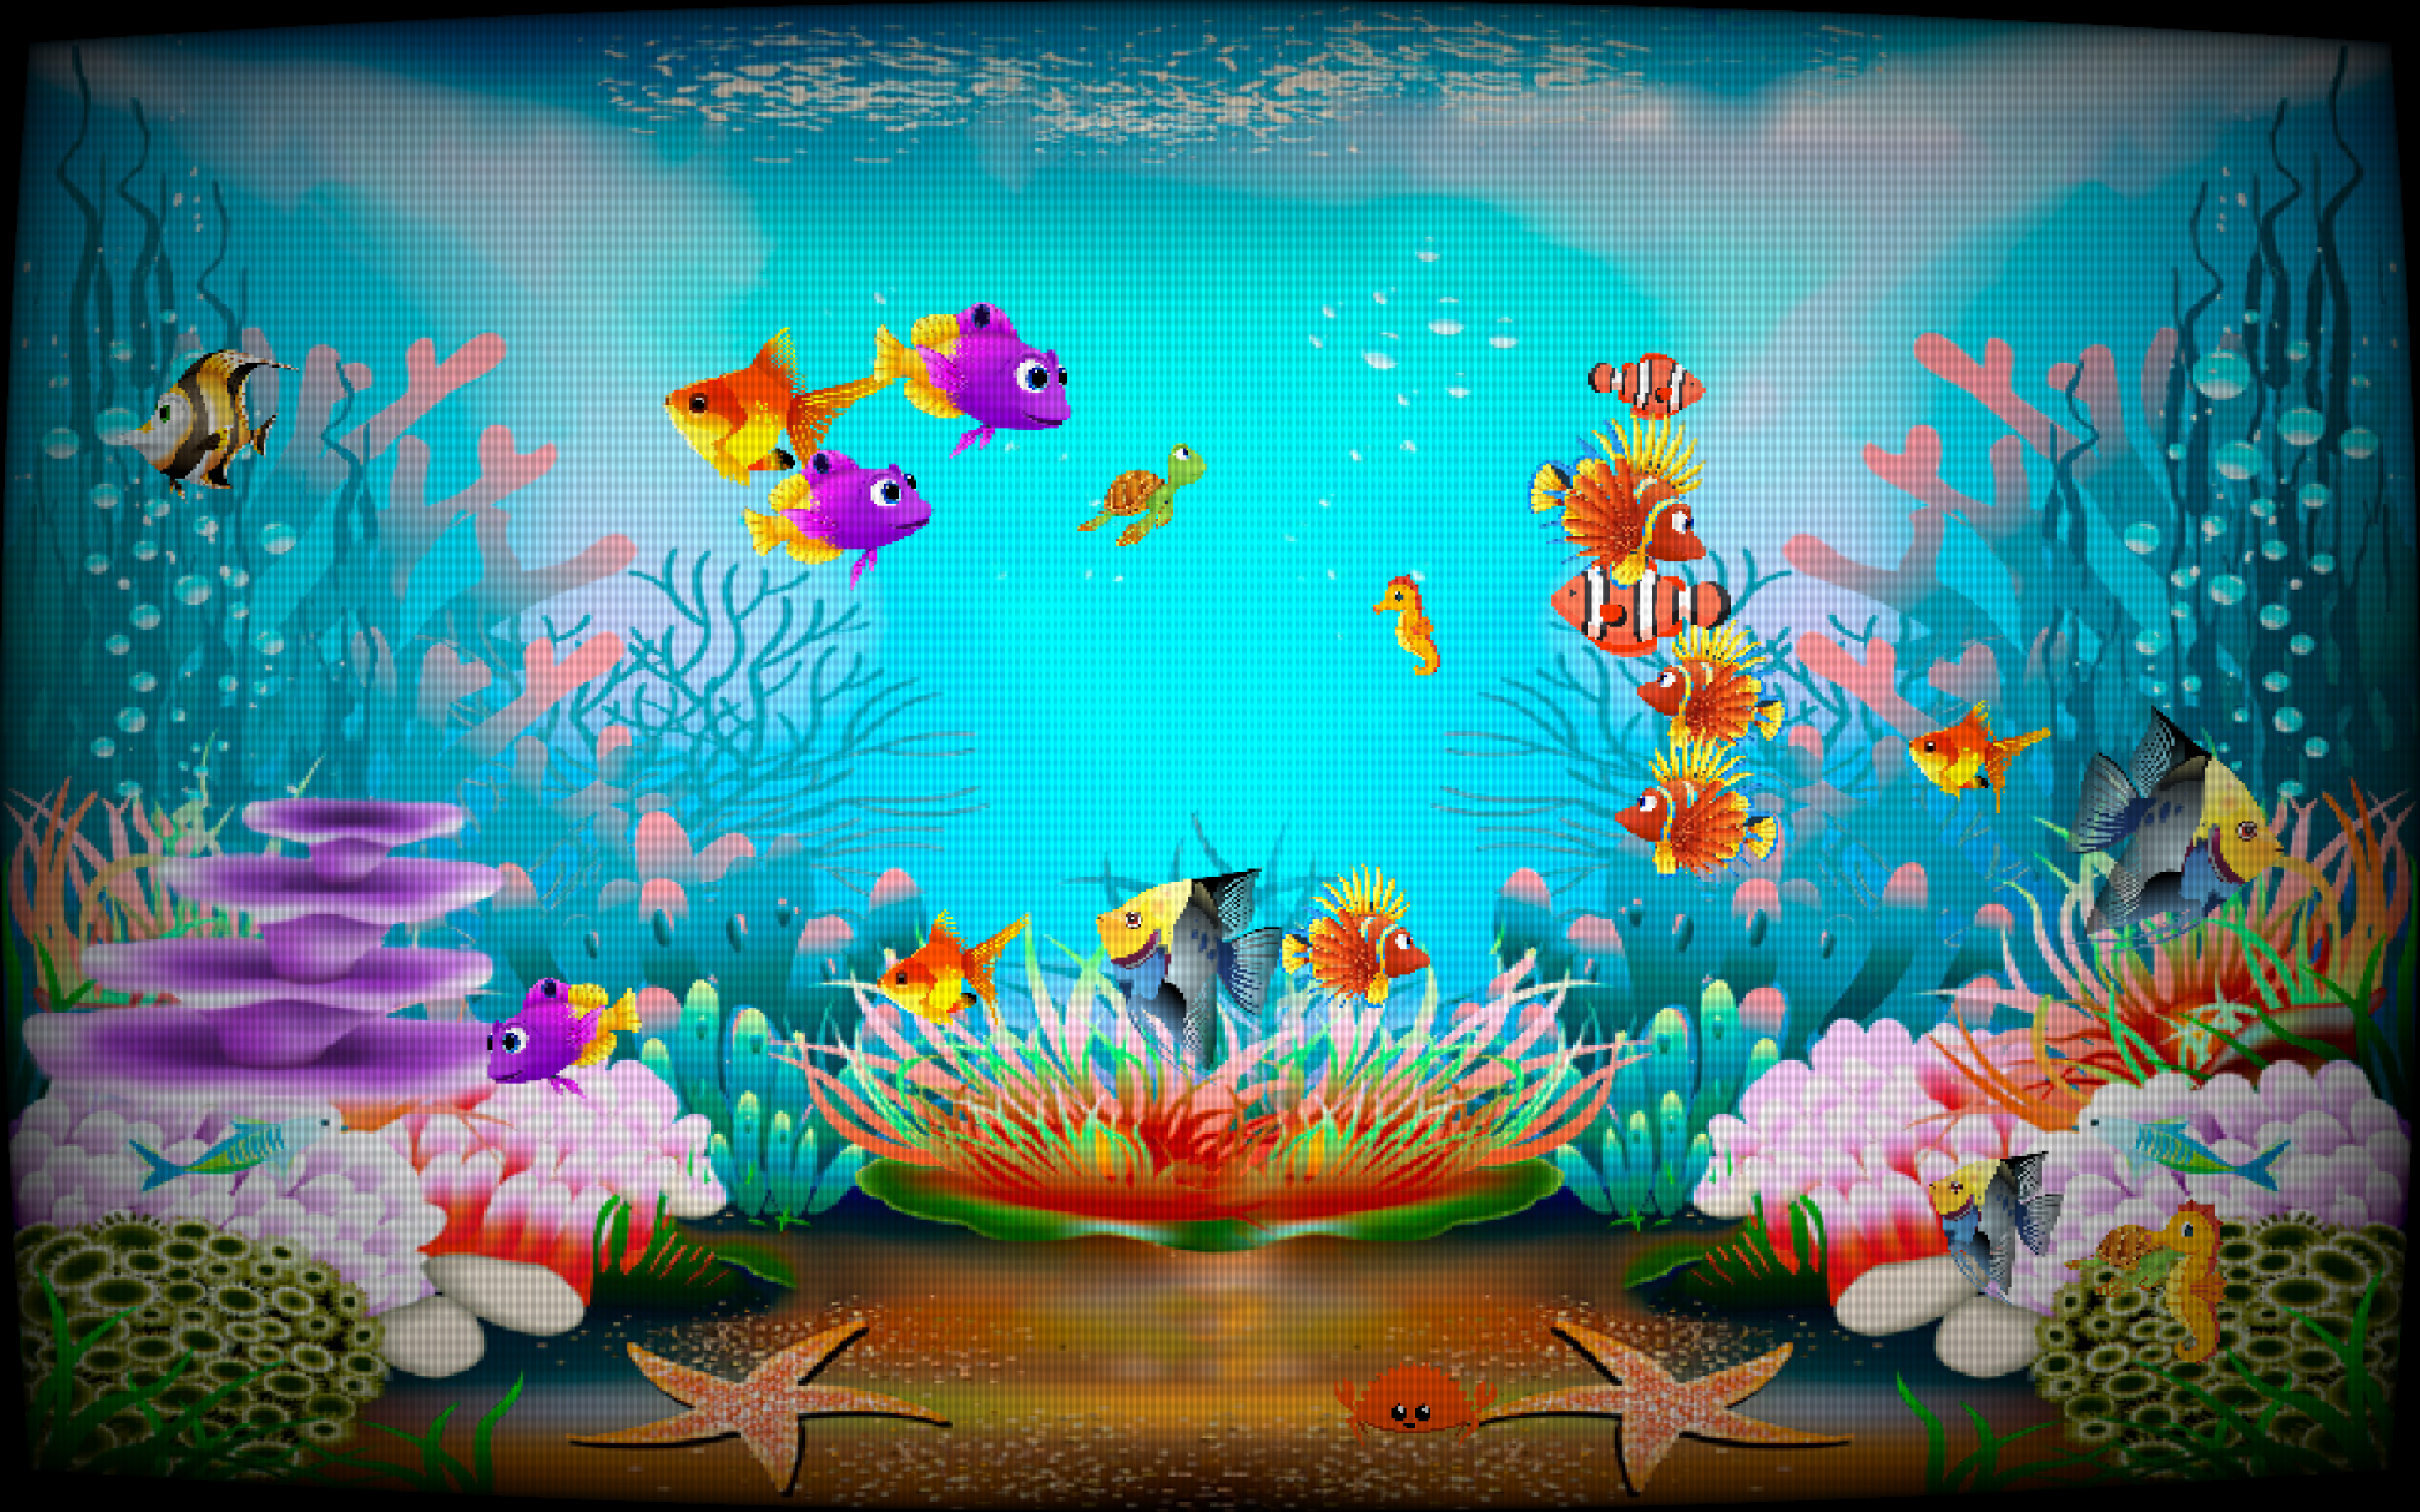
Rusty Aquarium is an application that visualizes data points as fish swimming around in an aquarium. It can be used to display data on a screen hanging in your office. The data points can be mapped to different species of fish, as well as their speed, size and movement bubbles.
Due to the nature of the fish tank not showing exact data, even sensitive information can be shown in a public area. Visitors who don’t know the specifics of what the fish represent will not see anything other than a serene aquarium.
When you show data in this way people tend to get invested. You could choose fish species to represent data from their business area and whenever they walk past the aquarium they look at it to see if “their” fishes show up.
I've had this idea for longer than I can remember, so I can't say how I came up with it. But I've always thought static graphs are quite boring to have up on a wall, and a fish tank screensaver would be more calming.
There has been multiple false starts trying to implement this. Once I downloaded the source code for a fish tank screensaver in C to modify it. But I couldn't even get it to compile. Another time I tried doing it with Unity, but the click heavy interface and video based tutorials weren't my thing.
When we received screens for showing analytics data at work, I decided it was time to pick up this idea again. Working with analytics is much more fun when the result is beautiful.
The reason I decided to use Rust is because I've been interested in trying it for a while. And when a colleague sent a link to Macroquad, it seemed like a good fit. It was easy to understand the code, and implementing a first version was very quick. That Rust and Macroquad can cross-compile to many different platforms, including HTML5, was also a deciding factor.
The easiest way to run Rusty Aquarium is to publish the wasm files on a web server. Then it’s just a matter of setting up a program that updates the inputdata.json file, or generates it on the fly. To display the aquarium, run a web browser in kiosk mode.
To use the aquarium as a screensaver, there are programs that can display a URL when it activates.
Put the screen up in the reception area, or some other place a lot of people pass through. Add a nice frame around the screen, to make it look more like an art piece, for an extra nice touch.
The file assets/inputdata.json is read to define what fish to display.
The field background is optional, and can be used to select which background
to show. The number should match the index of the wanted background from the
backgrounds field in config.json.
The field school must be an array of objects, one for each fish to display.
The fish field must match a name in the map of fishes in the config.json
file.
The fields size, speed, and bubbles are multipliers that will be applied
to the corresponding value from the fish configuration.

An example included with the application will show system monitoring data. Each CPU is represented by a fish, and the usage will determine its size. Every process is represented by a small fish, as well as usage of each disk.
One possible usage could be to represent requests to a web server. Maybe each important page is represented by a species of fish, the response time corresponds to the speed, and the body length represents the size of the fish.
Specific events may also show up as separate fishes, such as logins or a unique visitor.
In an e-commerce business each sale could represent a new fish, with the total amount corresponding to the size of the fish. The species might represent the category of the sale. Maybe the distance of the delivery could correspond to the speed of the fish.
Show build status with each type of fish representing a repository. Every build gets a new fish, the speed represents build time, and the size could represent time since build. Failed builds could possibly be represented by a sick or dead fish.

Rusty Aquarium is developed with the Rust programming language using the Macroquad game engine. It can be compiled to run natively on Windows, Mac and Linux, as well as web assembly that can run in the browser.