$ yarn install
$ yarn start
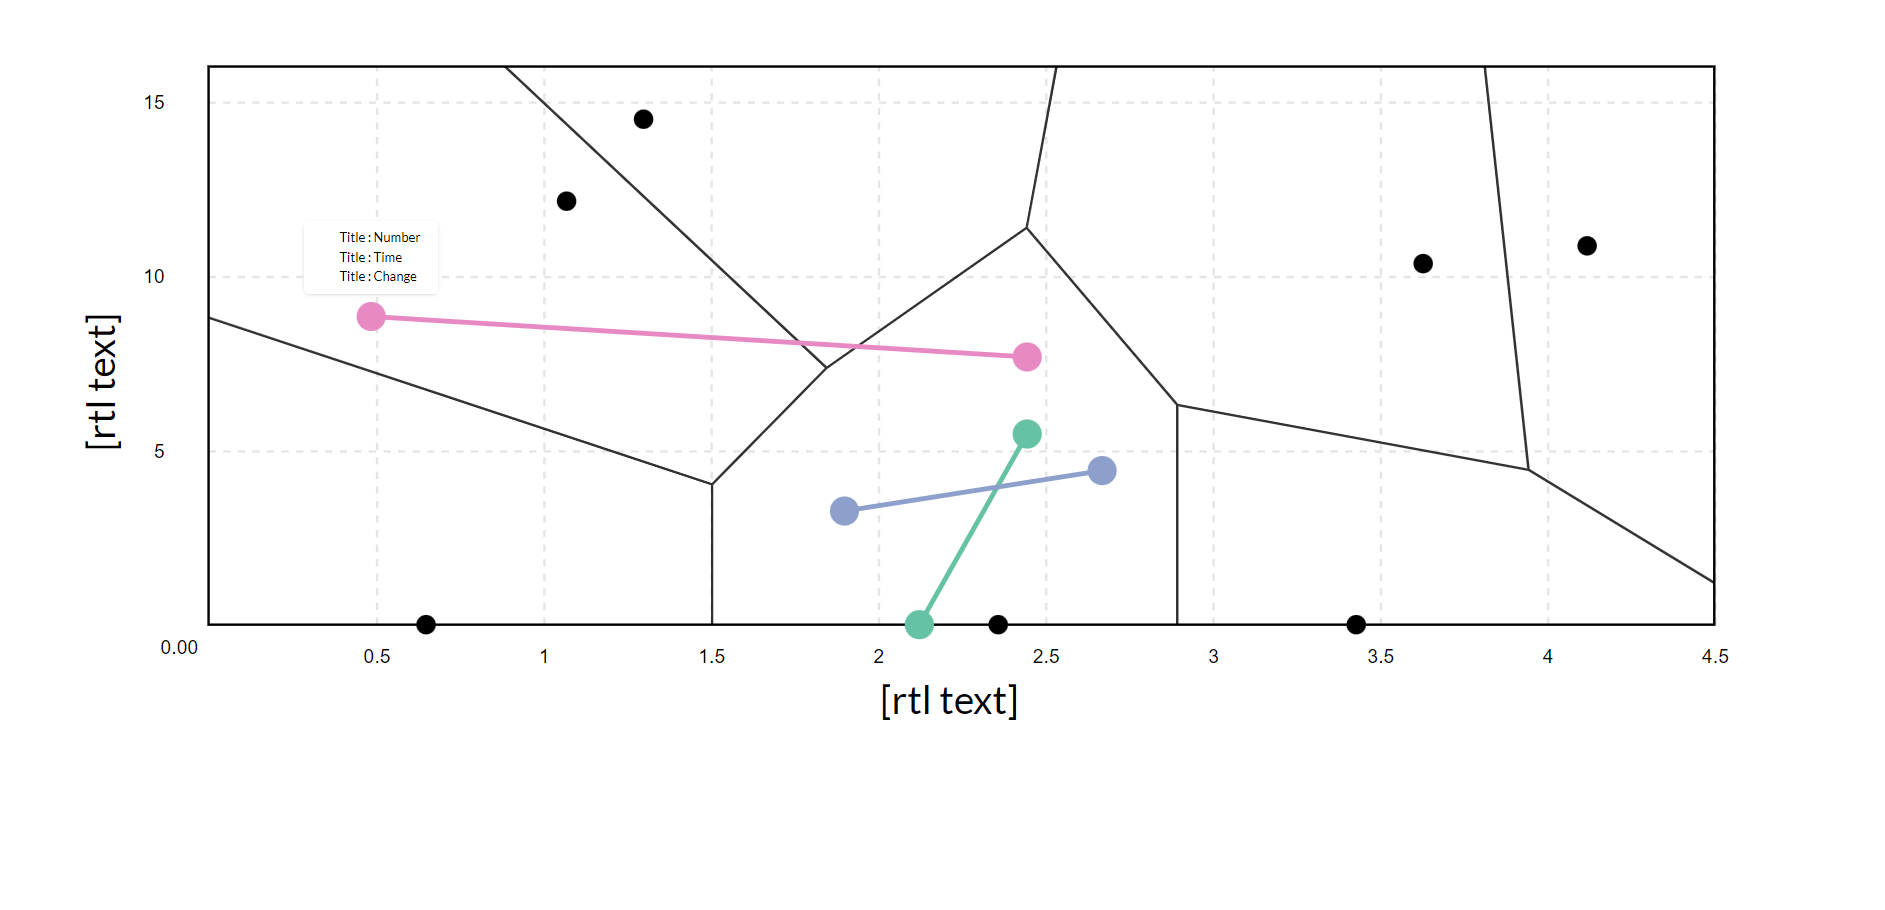
It's a voronoi chart that use d3.js and implemented as a react component
New features :
- Implement data scatter and cluster change chart on one base chart
- It supports rtl text for x & y axis label (it was a problem in d3.js to show rtl text label)
- It has a function to generate dynamic tooltip
- Every line in code has explained to better understanding