Skip to content

Using Bokeh python library for interactive visualization which uses web browsers for representation of graphs.

Notifications You must be signed in to change notification settings

Mantej-Singh/Interactive-Data-Visualization-using-Bokeh---Python

Folders and files

NameName
Last commit message
Last commit date

Latest commit


History

23 Commits


Repository files navigation

Interactive-Data-Visualization-using-Bokeh---Python

Using Bokeh python library for interactive visualization which uses web browsers for representation of graphs.

screenshot-1488388948.png

This notebook shows creation of interactive graphs with Bokeh Library
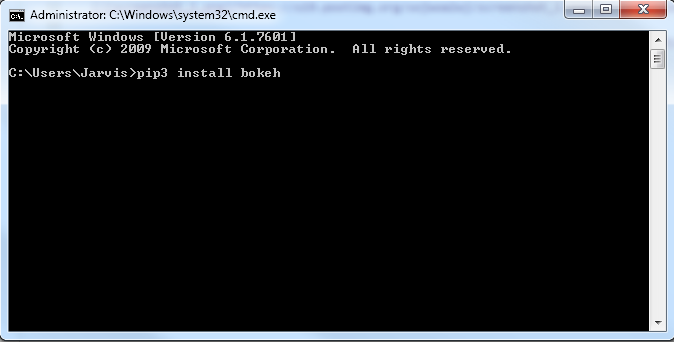
  • Install pip3 install bohek to install the source Bokeh library.

screenshot-1488338406.png


##Importing library for bar data

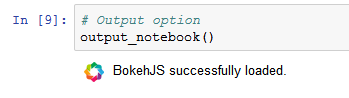
from bokeh.charts import Bar, output_file, show, output_notebook

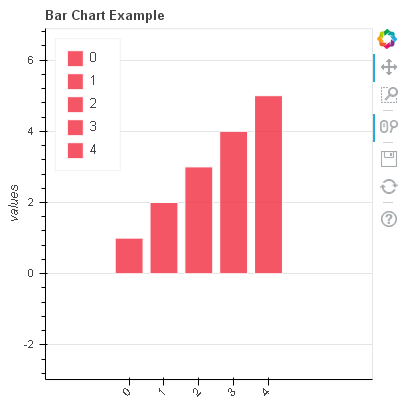
##Bokeh Inline Output1: [Bar Graph] screenshot_1488406982.png

screenshot_1488406859.png


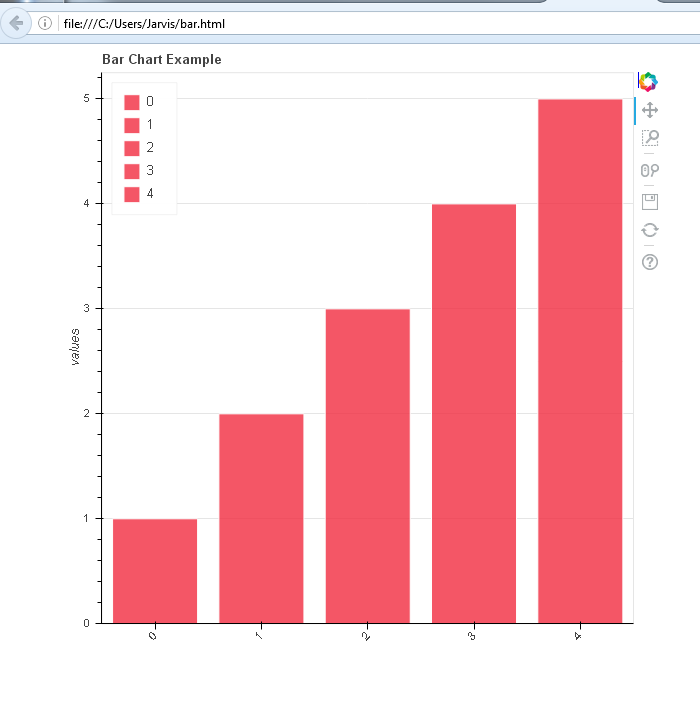
##Bokeh Local Output2: [Bar.html] screenshot_1488337778.png


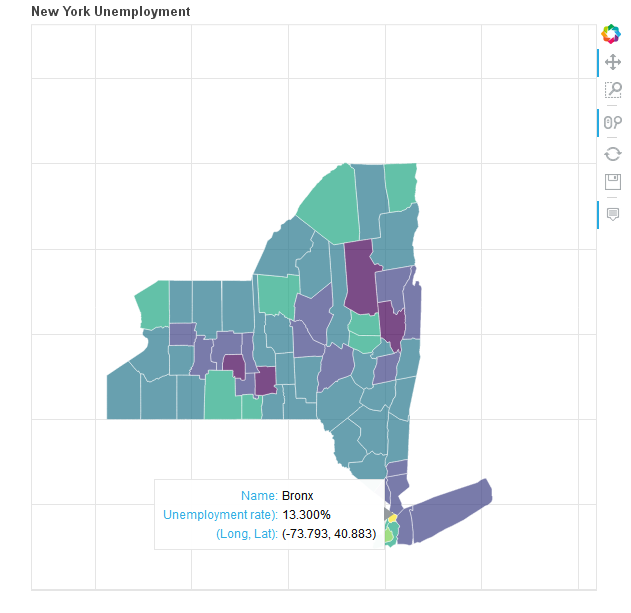
##Bokeh Inline Output3: [Choropleth Map] screenshot-1488411915.png

About

Using Bokeh python library for interactive visualization which uses web browsers for representation of graphs.

Topics

Resources

Stars

Watchers

Forks

Releases

No releases published

Packages

No packages published