Mapping earthquakes in Python 3.5 using Plotly
Here's my output: 8hrs of hardwork

The USGS earthquakes dataset, download it from Earthquake Hazards Program:
[Direct download link] (http://earthquake.usgs.gov/earthquakes/feed/v1.0/summary/all_month.csv)
cases = []
for i in range(len(types)):
    lim = types[i]
    df_sub = df.loc[df.type==types[i],:]
    cases.append(go.Scattergeo(
        lon = df_sub['longitude'],
        lat = df_sub['latitude'],
        text = df_sub['text'],
        name = types[i] + ' : '+str(len((df_sub))),
        marker = go.scattergeo.Marker(
            color = colors[i],
            sizemode = 'area'
                )
    ) )


layout = dict(
        title = '<b>Most Calamities</b>  <br>(Hover for details)',
        #colorbar = True,
        showlegend = True,
        geo = go.layout.Geo(
        showframe = False,
        showcoastlines = True,
        showcountries = True,
        showland = True,
        landcolor = 'rgb(217, 217, 217)',
        subunitwidth=1,
        countrywidth=1,
        subunitcolor="rgb(255, 255, 255)",
        countrycolor="rgb(255, 255, 255)"

        ),
    )

fig = go.Figure( data=cases, layout=layout )
py.iplot( fig, validate=False, filename='Eqack 1', fileopt='overwrite' )
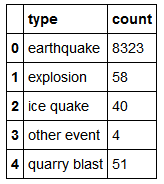
data1=df.groupby('type').count()