
Easily label line(s) using matplotlib.
The code is heavily based on http://stackoverflow.com/questions/16992038/inline-labels-in-matplotlib (original code from NauticalMile).
Just do:
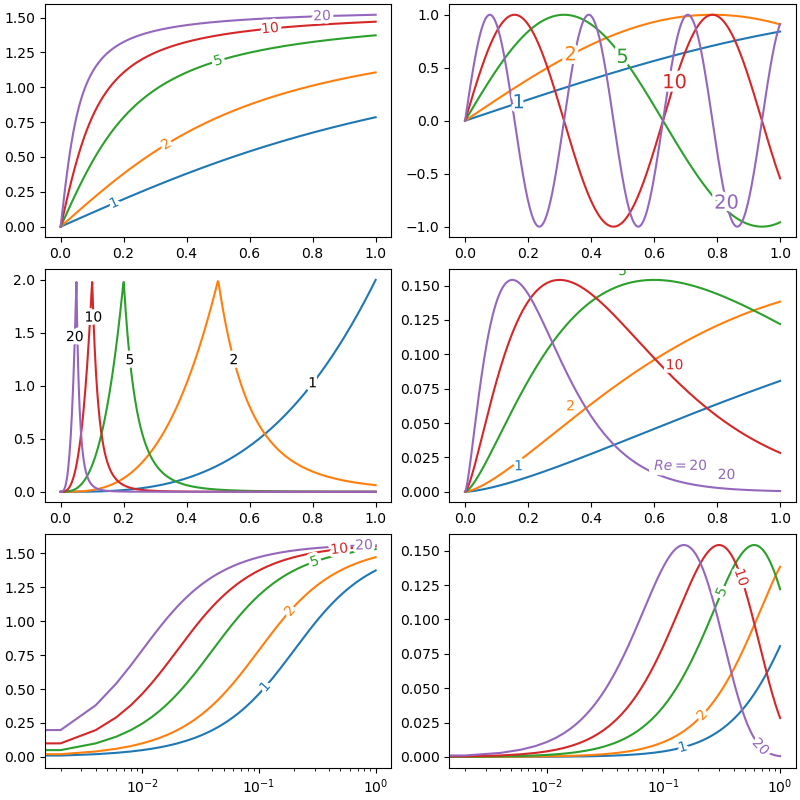
pip install matplotlib-label-linesYou can try it online on binder , get some inspiration from the example or from the following script:
import numpy as np
from matplotlib import pyplot as plt
from scipy.stats import loglaplace,chi2

from labellines import labelLine, labelLines

X = np.linspace(0,1,500)
A = [1,2,5,10,20]
funcs = [np.arctan,np.sin,loglaplace(4).pdf,chi2(5).pdf]

plt.subplot(321)
for a in A:
    plt.plot(X,np.arctan(a*X),label=str(a))

labelLines(plt.gca().get_lines(),zorder=2.5)

plt.subplot(322)
for a in A:
    plt.plot(X,np.sin(a*X),label=str(a))

labelLines(plt.gca().get_lines(),align=False,fontsize=14)

plt.subplot(323)
for a in A:
    plt.plot(X,loglaplace(4).pdf(a*X),label=str(a))

xvals = [0.8,0.55,0.22,0.104,0.045]
labelLines(plt.gca().get_lines(),align=False,xvals=xvals,color='k')

plt.subplot(324)
for a in A:
    plt.plot(X,chi2(5).pdf(a*X),label=str(a))

lines = plt.gca().get_lines()
l1=lines[-1]
labelLine(l1,0.6,label=r'$Re=${}'.format(l1.get_label()),ha='left',va='bottom',align = False)
labelLines(lines[:-1],align=False)

# labelLines also supports log-scaled x-axes
plt.subplot(325)
for a in A:
    plt.semilogx(X,np.arctan(5*a*X),label=str(a))

labelLines(plt.gca().get_lines(),zorder=2.5)

plt.subplot(326)
for a in A:
    plt.semilogx(X,chi2(5).pdf(a*X),label=str(a))

labelLines(plt.gca().get_lines(), xvals=(0.1, 1), zorder=2.5)

plt.show()