A collection of R scripts to model the within-host viral kinetics of SARS-CoV-2 and drug effects to inform drug repurposing. You can explore your own drugs by re-running the scripts with simulations or actual experimental data. We supply concentration profiles for several proposed treatments along with Monolix / mlxR code to repeat our simulations or build your own.
We fitted the viral kinetics to data published by Young et al. in early 2020. Additionally, we allow for acquired immunity to develop over the course of 1-2 weeks based on reports by Long et al., Nat. Med. 2020 and To et al., Lancet Inf. Dis. 2020. For a detailed description, please refer to "Modeling of SARS-CoV-2 Treatment Effects for Informed Drug Repurposing" (Kern et al., Front. Pharmacol. 2021).
The underlying model is the standard target-cell limited model extended with developing acquired immunity and drug effects, both represented by sigmoidal Emax models. Virus particles V infect a pool of susceptible (target) cells T with the cellular infection rate β. Infected cells I begin shedding virions at a production rate p. The effects of pharmacological treatments by different modes of action are described by the following variables:
- inhibition of viral entry into susceptible cells,
- by decreasing the cellular infection rate with effectiveness η,
- and/or by blocking viral production rate within infected cells with effectiveness ε.
The following figure shows simulated viral kinetic profiles following treatment with hydroxychloroquine, lopinavir/ritonavir, ivermectin, artemisinin, or nitazoxanide.
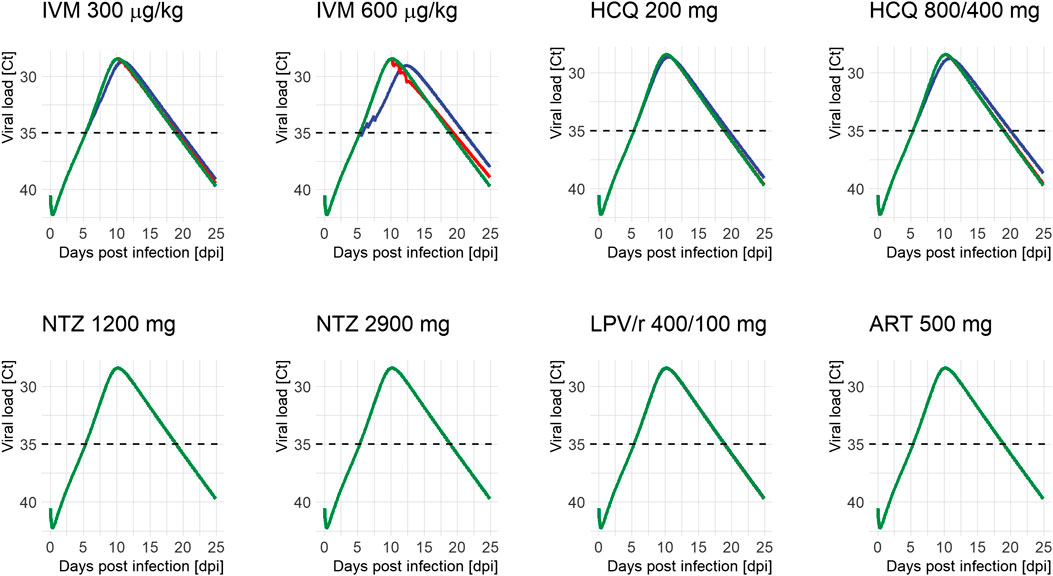
Viral load profiles of SARS-CoV-2 following different treatment regimens and initiation of treatment (green: untreated, blue: on positivity (5.4 days after infection), and red: on peak (10.2 days after infection)). Lines may overlap so that only one color is visible; simulations were always run for all time points. Ct: serial cycle threshold values; ART: artemisinin; HCQ: hydroxychloroquine; IVM: ivermectin; LPV/r: lopinavir/ritonavir; NTZ: nitazoxanide. Dosing of different modeled treatment regimens: IVM 300: 300 μg/kg every 24 h for 3 days; IVM 600: IVM 600 μg/kg every day for 3 days; HCQ 200: 200 mg every 8 h for 10 days; HCQ 800/400: 800 mg every 12 h for 1 day, then 400 mg every 12 h for 9 days; NTZ 1200: NTZ 1200 mg every 6 h for 5 days; NTZ 2900: NTZ 2900 mg every 12 h for 5 days; LPV/r 400/100: LPV/r 400/100 mg every 12 h for 14 days; ART 500: ART 500 mg once a day for 5 days.