Application to detect long term variable starts from series of data points.

This application is designed to receive a serie of points indicating the intensity of variable star candidates from a serie of observations distributed in time, with the following characteristics:
- The data contains outliers.
- The observations are very clustered, leaving big empty spaces.
- Since only long term variable stars are taken into account, the data doesn't exceed 2-3 cycles.
The application returns a trigonometric function that fits the data points, also indicating the reliability of that regression.
The regressions have the following form:

For the program to work the following python libraries are needed:
- numpy
- scipy
- mathplotlib
For running test.py you must provide .lc files from the ASAS and put them on the data folder, on the current directory.
The point ponderation is the multiplication of the following functions:
- Outlier ponderation:
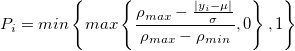
Where rho_max is set to 3.5 and rho_min to 2.5.
mu is the mean and sigma is standard desviation of the magnitudes.
- Clustered ponderation:

Where beta is the decay by clustering and is 10 for this application. Larger values imply that the ponderation decay due to near points propagates less.
- Add a function to calculate the likeliness of the fit.
- Find data of real long term variable stars (currently just using data from the ASAS).
- Evaluate the alternative fit form:
- Evaluate if making the outlier-ponderation be according to the standard desviation of the line of a linear regression and not only the (constant) mean.
