It's September 8th 2017 and Hurricane Irma is twisting her way towards Florida. Like 95% of home-owning Floridians, you have a home insurance plan. But, like most others, you don't have full flood or natural disaster coverage - in fact, 70% of people don't, and even of those that do usually aren't fully covered. With the storm approaching Category 4/5 speeds and almost certain landfall, no traditional insurance company will take your business (a surefire loss for them). CNN is telling you it might be the most damaging storm of the century. You can get out of the state, for sure, but still you wonder how to protect your most valuable asset: your home.
With Insuricane, you can sign up for short-term home insurance using our webapp. Our servers immediately calculate the probability of damage to your home, our optimal hedging portfolio, and your initial payment.
The basic idea of Insuricane that we can instantly hedge our risk of insuring your home (in a hurricane) by taking on a position in an negatively correlated portfolio. Most impoortantly, we can hedge the millisecond an order comes in, reducing basis risk by crafting the best hedge based on your home's precise location.
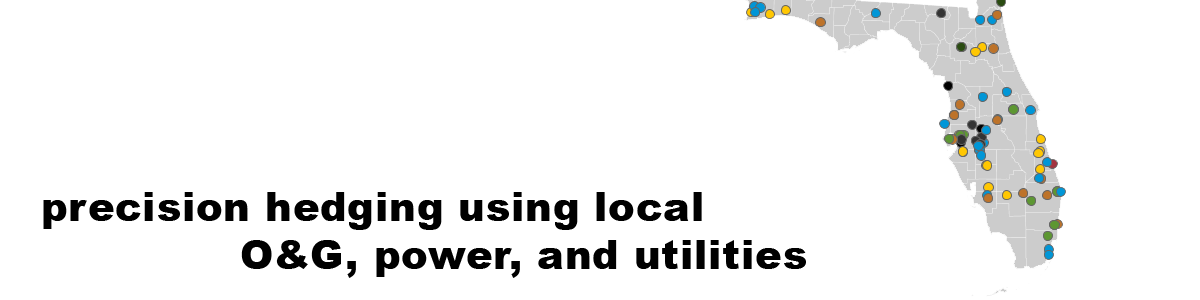
For example, we might short sell local utility and real estate holdings and go long on disaster suppliers like consumer packaged goods. For PennApps we've focused on utilities because there are several studies displaying a correlation following hurricanes. Here's the pipeline:
- The user inputs their address and reqested insurance coverage (in USD).
- We use NOAA hurricane data and our model to estimate the probability of the home being destroyed by the disaster. If it is too risky, we may chose not to offer the insurance product.
- Converting their address to latitude and longitude, use EIA data to find nearby power stations and utilities. There are 117 spread around Florida.
- We use a database we created to determine the owner of the power station. If the owner is not a publicly listed company, there is no way to use it to hedge and we delete the row.
- We use EIA data on electrical plant construction costs to estimate the $ loss to the public company if the utility were to be destroyed, and sum over all their utilities (and subsidiaries) in the affected area. This is a function of the type of plant and the capacity (in megawatts). If the loss is immaterial to the company it will not effect their stock price, and thus cannot be used to hedge. In that case we throw the row out.
- We determine the joint probability (i.e. home destroyed and asset destroyed) by a simple heuristic: inverse squared distance to the house.
- Companies that have made it to this step are valid members of our heding portfolio. We weight them according to their correlation with the house (5) and how material the damage would be to the company (damage divided by market cap).
- Having constructed a hedging portfolio and calculated the user's risk, we present the user with their premium. The premium is a lump-sum initial payment proportional to our estimation of our basis risk. The user can choose to buy the insurance or reject.
- The user signs our agreement with DocuSign and receives a confirmation email.
- Since this is a hackathon, the process stops here. If a real product, we'd automatically go short on our portfolio using a put spread in the options market (to hedge what is essentially binary payoff profile on our end).

The front end is built using React with Leaflet and DocuSign's API. The JS frontend interacts with a Python Flask microservice on GCP housing our data and GIS libraries. Our data on the precise location, power plant type, and owner was pieced together by several joins on EIA datasets. Predicted hurricane wind speed, path data, and location are derived from two NOAA datasets.
Specifically, our datasets are as follows from NOAA:
- Source: NOAA Irma
- Hurricane tracking folder: al112017_5day_037.zip (8:59 AM)
- Wind radius folder: al112017_fcst_037.zip (9:00 AM)
- We picked 9/8/17, 8-9AM as our "snapshot in time" for this case-study prototype, given that it is a couple days prior to landfall. At this point, there would be almost no supply of Floridian insurance, with a very strong probability of the hurricane causing destruction, but there would be time for people to act in emergency.
Our focus on Hurricane Irma allowed us to trim our database to Florida, though the EIA datasets are national and could be used for any US state. This was valuable in the time-sensitive goal of developing a working prototype. Ideally, a scaled implementation would include data and options across numerous different storms and regions of the nation.
We created a heuristics-based probabalistic model (lacking sufficiently detailed training data to build a linear/logistic model on) to forecast an estimation for the probability that a house/lat-long area is hit, including factors of:
- Distance to the center of the storm
- Which wind shield (nearest, middle, farthest) if any the house is in. This is correlated with the distance to the eye but provides us a proxy for wind speeds. Being closer to the center from these first two factors leads to a greater probability of the house being hit.
- Distances to various wind shields
This model gives us probabilities (as estimates) of damage in the area. This is a proxy for the amount that needs to be insured:
- Our program takes in household location data and uses the storm tracking information to determine the likelihood of a house being hit by a storm. However, the sparsity of data we had made this challenging to do:
- We did not have training or test data, which impeded us from using a trained regression model. Although there is data for general regions, our project focuses on specific properties and there is not data on a household level for destruction.
- We also do not have wind speed or rainfall predictions at each level.
- Although wind speed is a key factor for hurricane destructive power, the forecasts for it at specific points are not released in public data, meaning we cannot predict it in advance.
- Moreover, rainfall estimates typically only are released closer to landfall, but the goal of this program would be to give people a system to purchase insurance on in advance of the storm approaching.
- The predictions we have are on daily forecasts from NOAA, which means we would not be able to interpolate data effectively between two days. Although that location ideally should not be incredibly important (it is unlikely to assume that people would only wait until the last half-day possible to purchase insurance), it makes our application less responsive than ideal.
- Moreover, we have downloaded data from a specific time frame (9/8/17, 8-9AM EST; 2 days prior to Floridian landfall of Irma). Having a way to stream in data as NOAA updates would be critical for usability of this product.
- It is also not possible for us to perform emergency insurance functions that take into account the chance of the house itself suffering a deal of damage (i.e. does a house look like it may be slightly damaged or completely flattened).
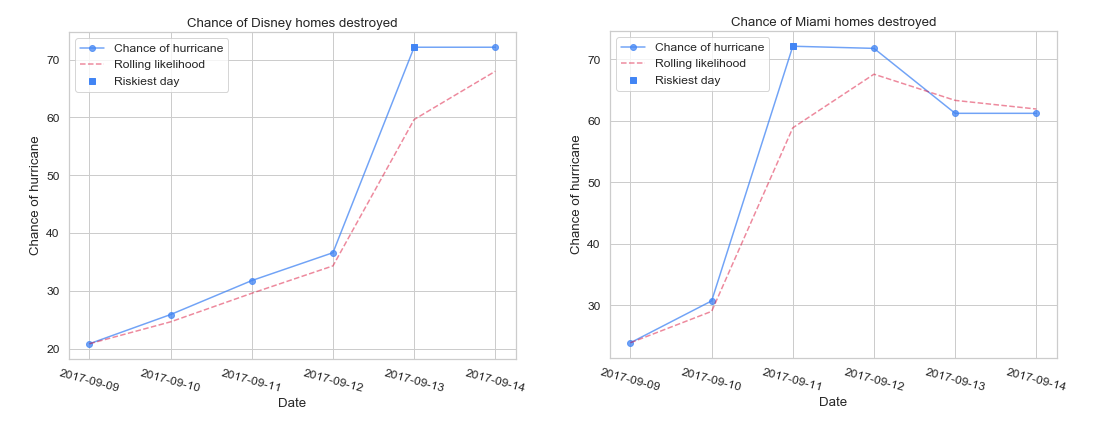
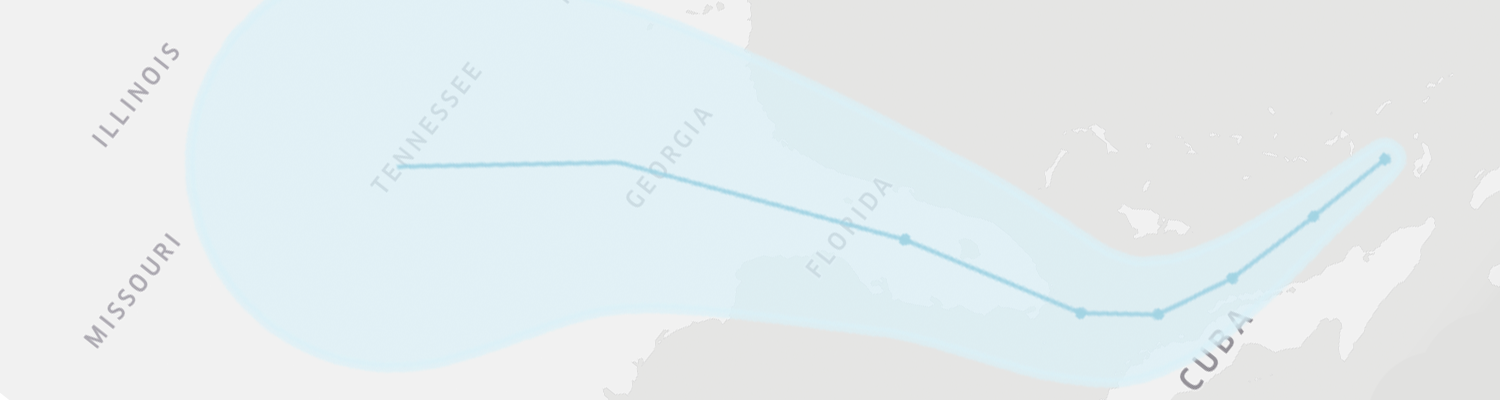
- Finally, we are generally underpredicting locations that are "farther along" the cone; namely; locations that are in the latter days of the cone and where the hurricane is estimated to turn towards. We can see this above in our Miami and Orlando graphs, and we can see below how, due to the days and uncertainty of storm movement, we see there is a greater error cone (the shaded blue below). This means we may actually underestimate the risk as it stands.
We believe Insuricane should be made into a real product for the benefit of Americans at risk of hurricanes. Further back-testing of our models would validate the viability of this derivatives/insurance strategy, as we scale it beyond just a hurricane-based system towards numerous types of natural disasters.
Developing the business further, as with any insurance/risk management product we need to create an efficient way to manage claims and payouts to help consumers. There is valid argument that providing a derivatives product that consumers could directly buy from us, rather than an insurance policy, would be easier to manage than insurance; counterarguments to that include that (1) consumers may not feel as comfortable with financial trading and (2) people may not have credentials, etc. set up for themselves.
From a venture perspective, if we are to pursue it, we believe the best course is to see investment from a well heeled insurance company that could bear the counterparty risk. They would be an eager strategic investor because (1) people tend to buy more insurance after disaster strikes and (2) the investment would serve as a hedge against their existing business. Financial services institutions such as commercial banks may also be interested, as a means of both (1) providing additional value to their customers (especially if they have housing loan options) in times of need, and (2) breaking into the insurance field as a new disruptive player.