An R-package of simplified GSEA. This is my first writing a whole r-package code. The package is only used to simple analyze GSEA with the most default parameters, but the result of siGSEA is similar to official GSEA. The purpose of writing this package is the reason that i feel the R code of GSEA in its web is so old (2005) that i want to rewrite.
library(devtools)
install_github("kaigu1990/siGSEA")
Loading libraries
library(Matrix)
Loading expression file and gene set file (expr data and gene set files are modified test files from GSEA web)
data<- read.table(file = "Gender_test.gct", sep = "\t", header = T, row.names = 1, stringsAsFactors = F, quote = "")
group <- c(rep("m", 15), rep("f", 17))
class <- factor(group)
gene_set <- readLines("C1.gmt")
Running siGSEA
res <- simple_gsea(dataexpr = data,
               	   group = class,
                   geneset = gene_set,
                   gsminsize = 15,
                   gsmaxsize = 500,
                   nperm = 1000)
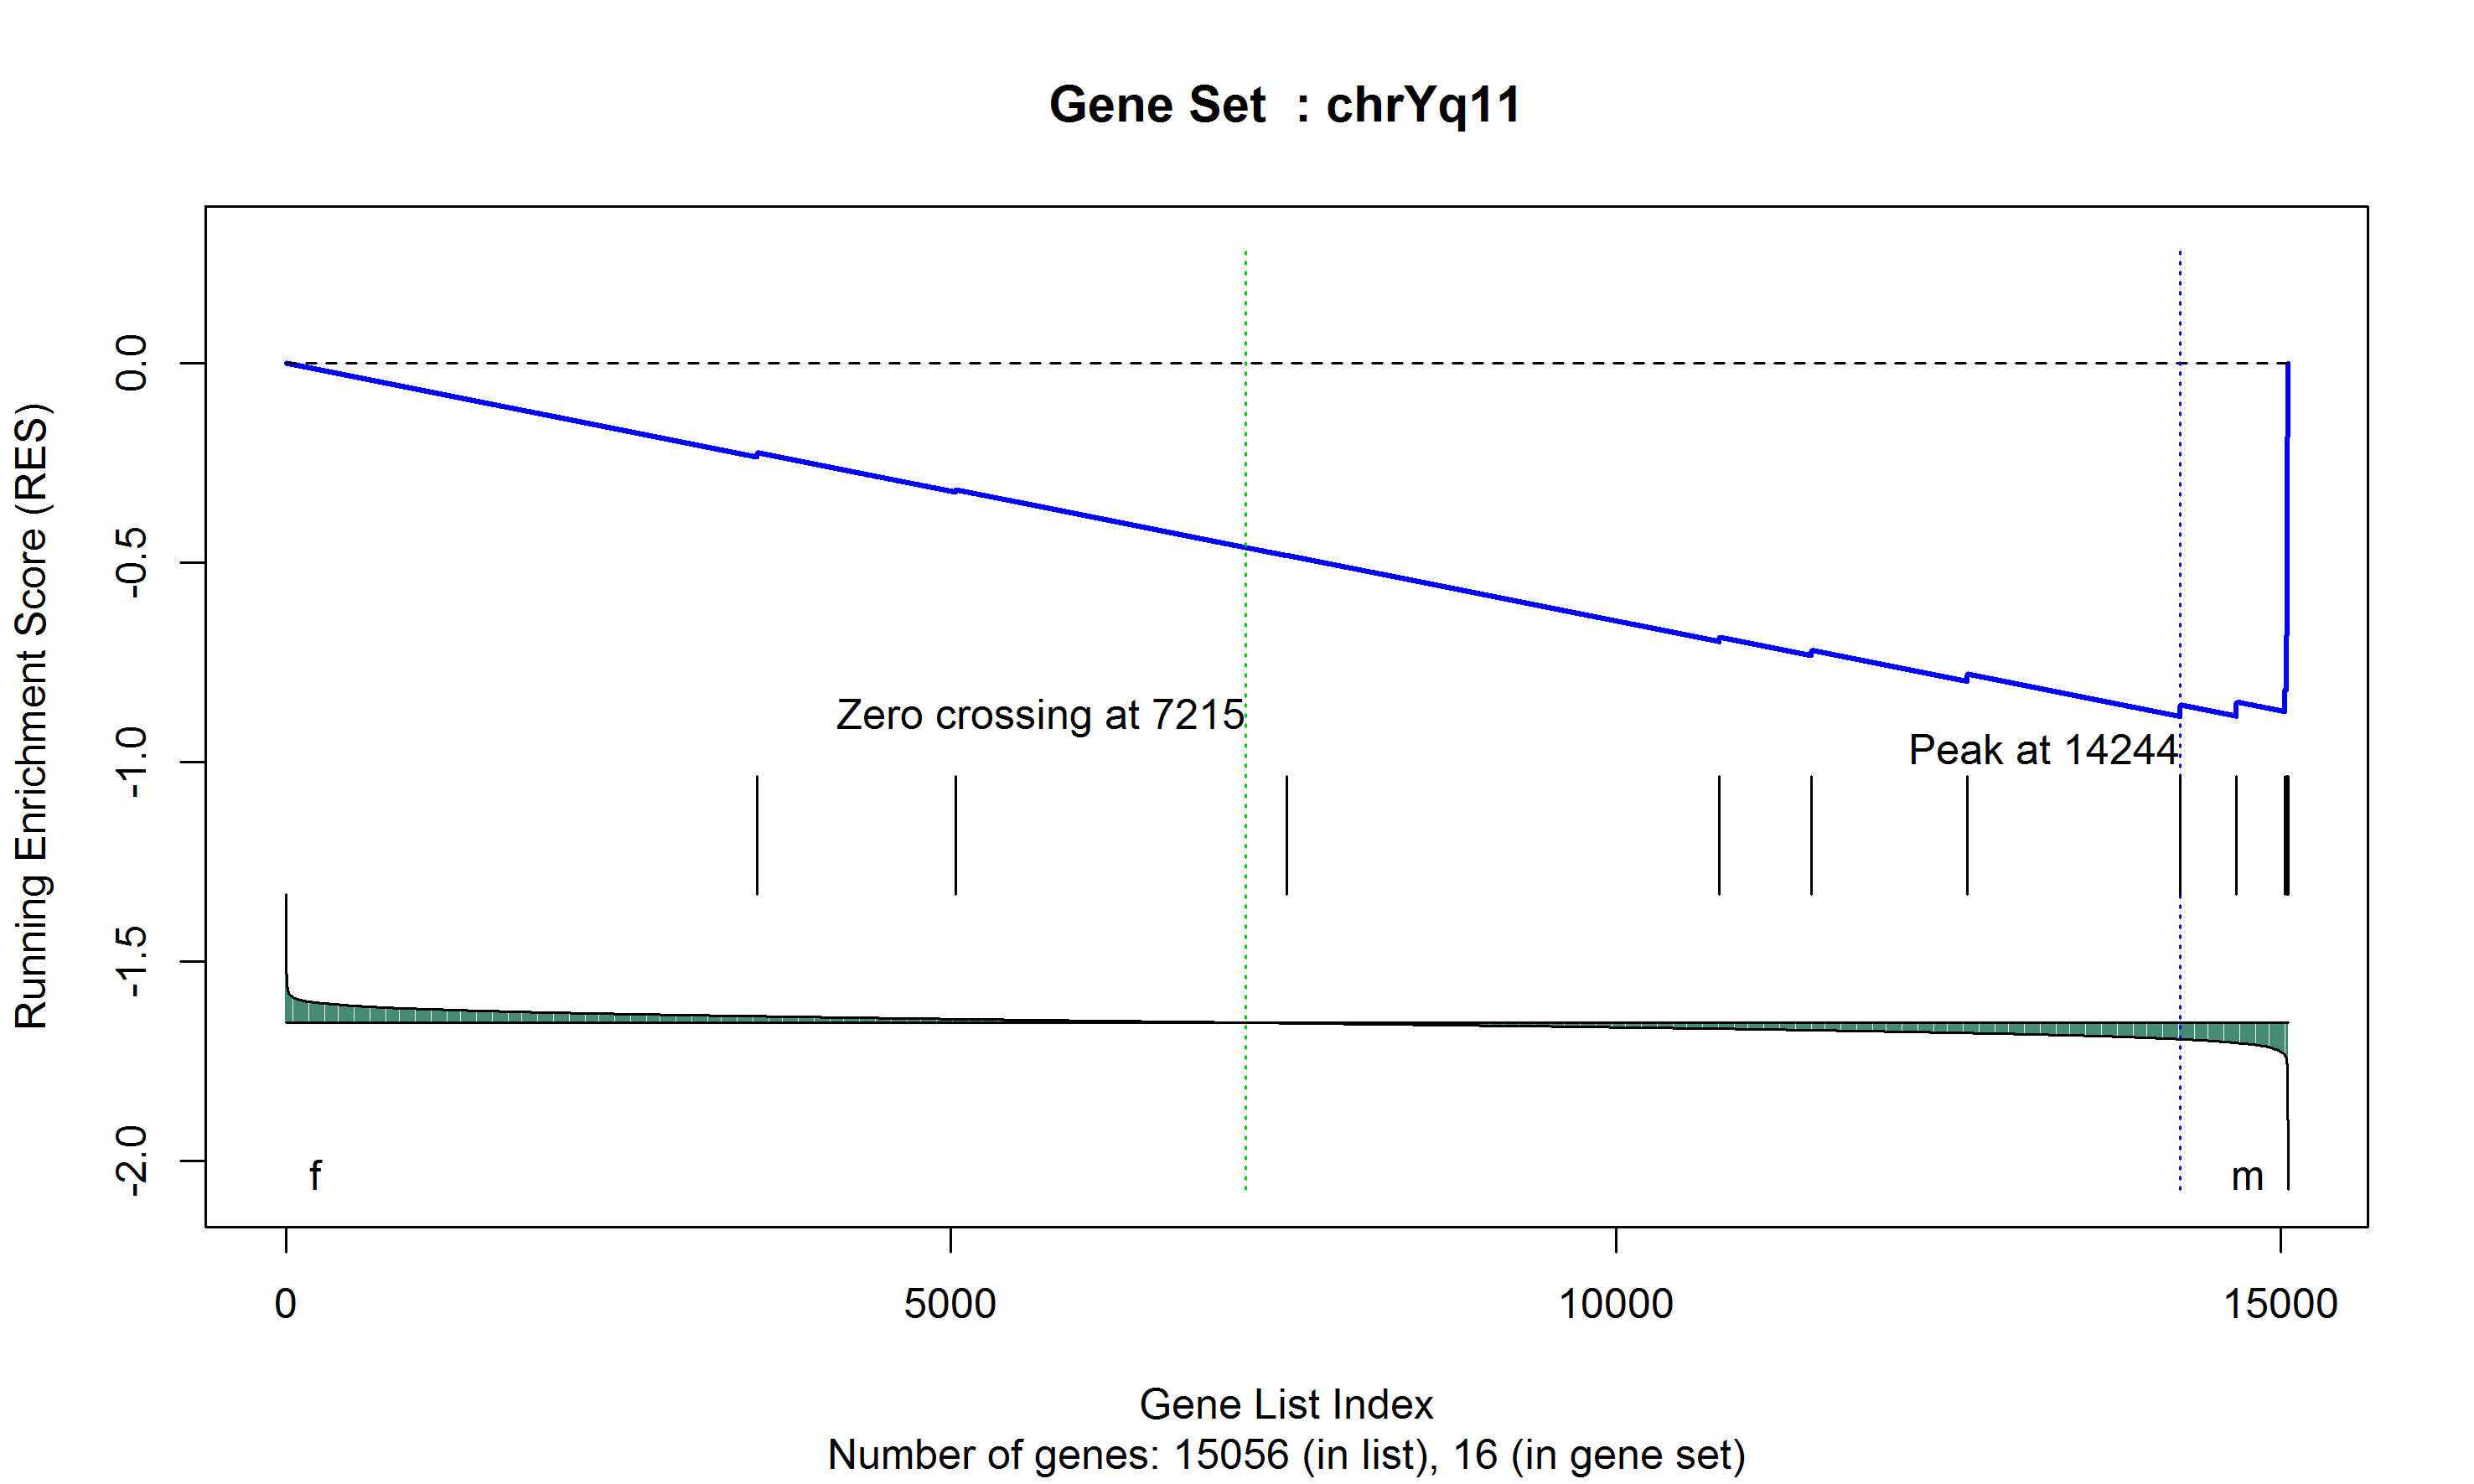
Plot GSEA graph
-
Show a certain gene set
gseaplot(expr = data, list = res, gset = "chr10q11") -
Output all gene set, such as nompval < 0.05 & FDR < 0.25
gseaplot(expr = data, list = res, gset = NULL, nompval = 0.05, fdr = 0.25)