A project about Serious Injuries and Fatalities tailored for Power and Electric Company. Analyzing the variables and factors involving injuries and fatalities in an Electrical Field Industry using Data Science, Data Analysis and tools like Tableau, Google Looker Studio and Power Bi, Python Programming, SQL Programming and many more

- To research the necessary factors and variable that revolves around Electrical Field injuries and fatalities
- To analyze the schema and diagram for the SIF Project
- To create and design the database
- To present different means of presenting data using Data Science techniques, programming
- To apply Data Analysis techniques and process like data cleaning, data munging, data wrangling, data manipulation
- To use PowerBI, Tableau, and Google Looker studio in presenting different aspects of data involving injuries and fatalities in Electrical Field Industry
- To create a website that enables the audience to see the output report of the data gathered
- To use API or hyperlinks to connect different platforms used from data gathering, data cleaning until data presentation
- To test the functionality of each dashboards
- To test the real time integration FROM WEBAPP TO MICROSOFT SOFTWARES >>> FROM WEBAPP TO POWERPOINT PRESENTATION >>> FROM WEBAPP TO WEBAPP>>> FROM WEBAPP TO MY OWN CREATED WEBSITE
- To do data integration testing and data quality assusrance testing during the start of the project until it is finished
- Be sure to add description for each DASHBOARD FUNCTIONS.
- Be sure to interconnect each graphs in each dashboards especially in Tableau.
- To include the program for embedding the dashboards in any websites
- To produce 3 Dashboards in PLAN 1
SIF stands for Serious Injury and Fatality. SIF prevention methods are all about stopping these kinds of accidents from happening in the workplace. There are a number of ways to achieve SIF prevention, and effective strategies typically involve a combination of approaches.
-
Hazard Identification and Risk Assessment: -- Proactive identification of high-energy hazards is crucial. This involves inspecting workplaces, reviewing past incidents, and understanding the tasks performed by workers. Once hazards are identified, steps can be taken to assess and mitigate the risks.
-
Implementing Effective Safety Controls: -- There are two main types of controls: eliminating hazards altogether and implementing safeguards to minimize harm if an accident occurs. Examples include using guardrails when working at heights, ensuring proper ventilation when working with chemicals, and requiring workers to wear Personal Protective Equipment (PPE).
-
Building a Strong Safety Culture: -- This goes beyond just having rules in place. It's about creating an environment where everyone feels empowered to identify and report safety hazards, and where following safety procedures is the norm. This can be achieved through training, leadership commitment, and open communication.
-
Data Analysis and Improvement: -- Safety programs should be data-driven. By collecting and analyzing information on near misses and past incidents, organizations can identify trends and areas where they need to focus their SIF prevention efforts.
- Unique identifier for each incident
- Data when the incident occured
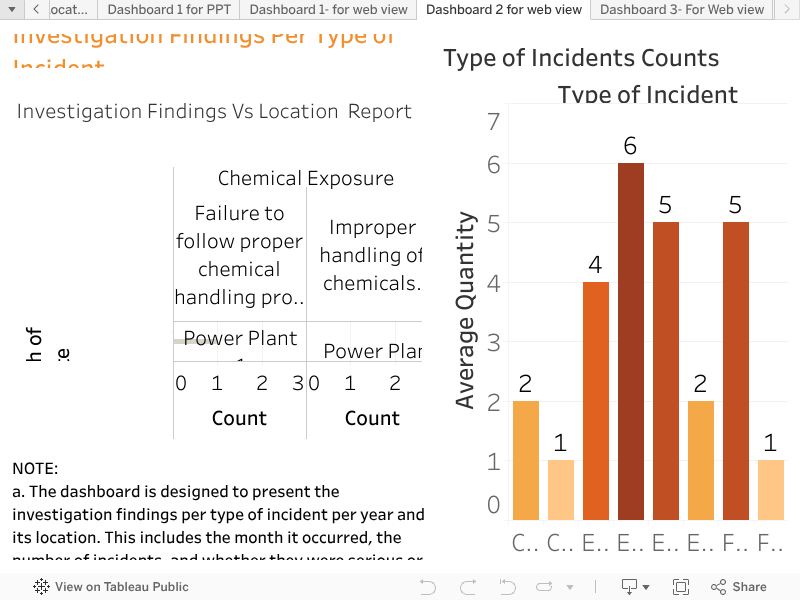
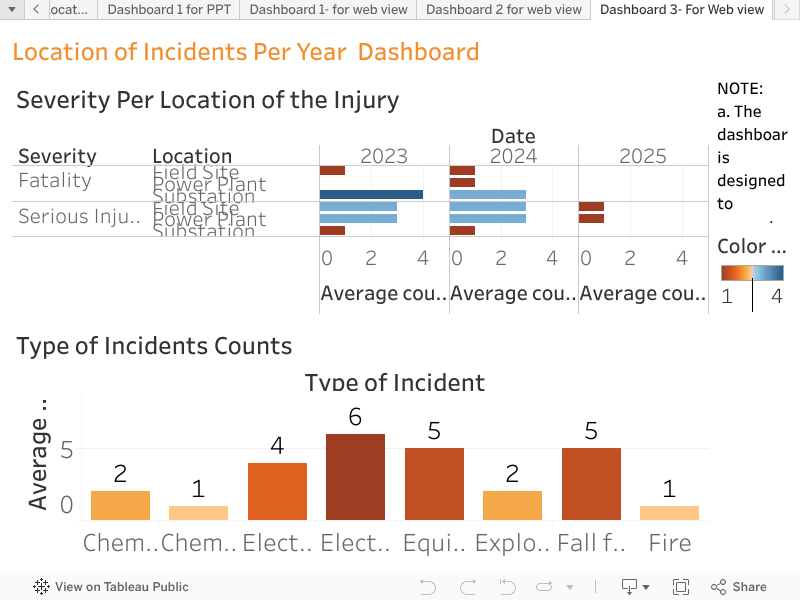
- Specific location where the incident took place (eg. Substation, power plant, field site)
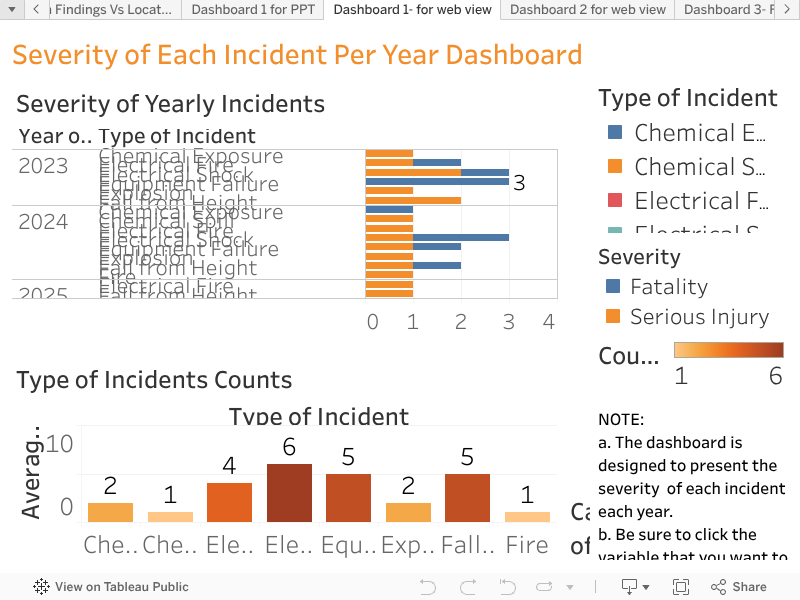
- Categorization of the incident (eg. Electrical shock, fall from height, equipment failure)
- Classification of the incident severity (serious, injury , fatality)
- Detailed description of what happened.
- Root cause of the incident (e.g., human error, equipment malfunction, environmental factors).
- Information about the victim(s) involved (e.g., job title, years of experience, age).
- Personal protective equipment (PPE) used at the time of the incident (e.g., gloves, helmets, harness).
- Names or number of witnesses to the incident.
- Summary of findings from the incident investigation.
- Actions implemented to prevent recurrence of similar incidents.
- The agency or authority to which the incident was reported (e.g., CCOHS , OSHA, local regulatory body).
- Any legal actions or fines resulting from the incident.
- Database to data ETL EXCEL to Tableau for Story Telling and presentation
- Database creation- SQL Programming- Excel to Google Looker Studio
- Excel to PowerBI for Presentation
- Excel to Python programming using Data Science and Data analysis processes and tools.
- Unprocessed dataset https://drive.google.com/file/d/1jX81EraAeQRSsv_d-X6ojspXJuLxgOrk/view?usp=drive_link
- Cleaned and processed dataset https://drive.google.com/file/d/19RNZWOXIB5q8gxm-EBhDmgk1LV3WHM_b/view?usp=sharing
- Replaced OSHA to CCOHS to standardize the data
- Remove empty cells
- Removed the duplicates


-
Importing the cleaned data to the tableau. Extracting the datasets and manipulating the necessary variables

-
Manipulated my variables on my Tableau to suit to my needs to present different information by graphs on each sheet


Program to embed in any website
Program to embed to any website
Program To Embed to any website
- To use create a web based platform that aggregates data involving injuries and fatalities in Electrical Field Industry
- To apply data management and controls for the 3 to 4 projects under Project Safety AI
- To apply Machine Learning, NLP and LLM in creating models for the platform.
- To apply data quality, data testing, data programming
- To use quantitative and qualitative analysis that revolves around risk management and Job hazard management
- To create and design a web based data analysis platform that automatically produced graphs and charts based from the input of the user in real time
- To create and design a web based visual NLP task application
Embed Tableau to Powerpoint https://www.vizwiz.com/2012/05/tableau-tip-embedding-dashboard-in.html