How to Implement Charts in Flutter
In this article we will learn how to implement charts in flutter. Charts are very useful in statistical representation. Flutter provide a rich chart plugin named as charts_flutter. We will implement charts_flutter plugin in this article. We will only cover bar charts in this article and rest in next article.
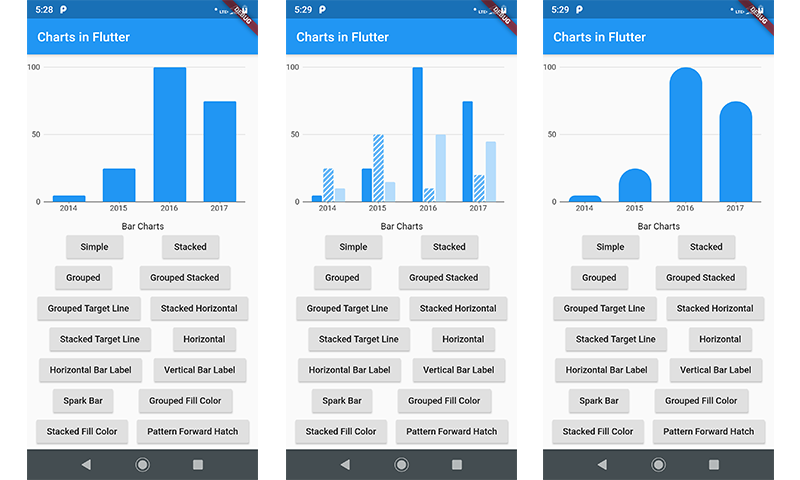
- Simple Bar Chart
- Stacked Bar Chart
- Grouped Bar Chart
- Grouped Stacked Bar Chart
- Grouped Target Line Bar Chart
- Stacked Horizontal Bar Chart
- Stacked Target Line Bar Chart
- Horizontal Bar Chart
- Horizontal Bar Label Bar Chart
- Vertical Bar Label Bar Chart
- Spark Bar Bar Chart
- Grouped Fill Color Bar Chart
- Stacked Fill Color Bar Chart
- Pattern Forward Hatch Bar Chart
- Horizontal Pattern Forward Hatch Bar Chart
- Grouped Stacked Weight Pattern Bar Chart
- Custom Rounded Bars Bar Chart
-
First and basic step to create new application in flutter. If you are a beginner in flutter then you can check my blog Create a first app in Flutter. I have created an app named as “charts_in_flutter”
-
Open the pubspec.yaml file in your project and add the following dependencies into it.
dependencies:
 flutter:
   sdk: flutter
 cupertino_icons: ^0.1.2
 charts_flutter: ^0.7.0
- Create new file named as “sales_data.dart”. This file contains basic data structure for charts. Insert following code for data structure.
class OrdinalSales {
 final String year;
 final int sales;

 OrdinalSales(this.year, this.sales);
}
- Now, go to main.dart and import chart plugin.
import 'package:charts_flutter/flutter.dart' as charts;
- Then create basic structure for the app in main.dart file to implement the chart container. Create structure like output screenshot as above. Following is the code for only simple chart. You can download the full source code and checkout all the charts.
import 'package:flutter/material.dart';
import 'package:charts_flutter/flutter.dart' as charts;
import 'package:charts_in_flutter/sales_data.dart';

void main() => runApp(HomePage());

class HomePage extends StatefulWidget {
 @override
 _HomePageState createState() => _HomePageState();
}

class _HomePageState extends State<HomePage> {
 Widget chartContainer = Column(
   mainAxisAlignment: MainAxisAlignment.center,
   children: [Text('Chart Viewer')],
 );

 @override
 Widget build(BuildContext context) {
   return MaterialApp(
     home: Scaffold(
       appBar: AppBar(
         title: Text('Charts in Flutter'),
       ),
       body: SingleChildScrollView(
         child: Column(
           children: <Widget>[
             Container(
               height: 250,
               child: chartContainer,
             ),
             Padding(
               padding: EdgeInsets.only(top: 10),
               child: Text('Bar Charts'),
             ),
             Row(
               mainAxisAlignment: MainAxisAlignment.spaceEvenly,
               children: <Widget>[
                 RaisedButton(
                   child: Text('Simple'),
                   onPressed: () {
                     setState(() {
                       chartContainer = SimpleBarChart.withSampleData();
                     });
                   },
                 ),
               ],
             ),
           ],
         ),
       ),
     ),
   );
 }
}
- Following is the implementation of simple bar chart. Put below code in main.dart file.
class SimpleBarChart extends StatelessWidget {
 final List<charts.Series> seriesList;
 final bool animate;

 SimpleBarChart(this.seriesList, {this.animate});

 /// Creates a [BarChart] with sample data and no transition.
 factory SimpleBarChart.withSampleData() {
   return new SimpleBarChart(
     _createSampleData(),
     // Disable animations for image tests.
     animate: false,
   );
 }

 @override
 Widget build(BuildContext context) {
   return new charts.BarChart(
     seriesList,
     animate: animate,
   );
 }

 /// Create one series with sample hard coded data.
 static List<charts.Series<OrdinalSales, String>> _createSampleData() {
   final data = [
     new OrdinalSales('2014', 5),
     new OrdinalSales('2015', 25),
     new OrdinalSales('2016', 100),
     new OrdinalSales('2017', 75),
   ];

   return [
     new charts.Series<OrdinalSales, String>(
       id: 'Sales',
       colorFn: (_, __) => charts.MaterialPalette.blue.shadeDefault,
       domainFn: (OrdinalSales sales, _) => sales.year,
       measureFn: (OrdinalSales sales, _) => sales.sales,
       data: data,
     )
   ];
 }
}
- Great, you are done with chart implementation in flutter. Run this project in device or emulator and check the output.
In this article we have learned how to implement charts in flutter. I have implemented bar charts only but you can implement other type of charts by taking a reference of main plugin site.