A simple server load bash and R script hack for graphing CPU, disk and RAM usage
Run ./serverload.sh /dev/sdb2 20, this will gather CPU, RAM and disk usage of /dev/sdb2 every 20 seconds.
To create the graphs just run Rscript systemLoad.R input/mylogfile-2019-etc, you will get three png images in your current directory.
You can use the get-graphs.sh script if you have docker and don't want to install R locally, see the "Manual usage" instructions below for that. I should probably refine this readme. Feel free to complicate things by following the instructions below ;)
If you're not running Ubuntu or don't have eog installed, you need to edit the get-graphs.sh script and remove the last line so it doesn't automatically try to open the SystemLoad.png graph.
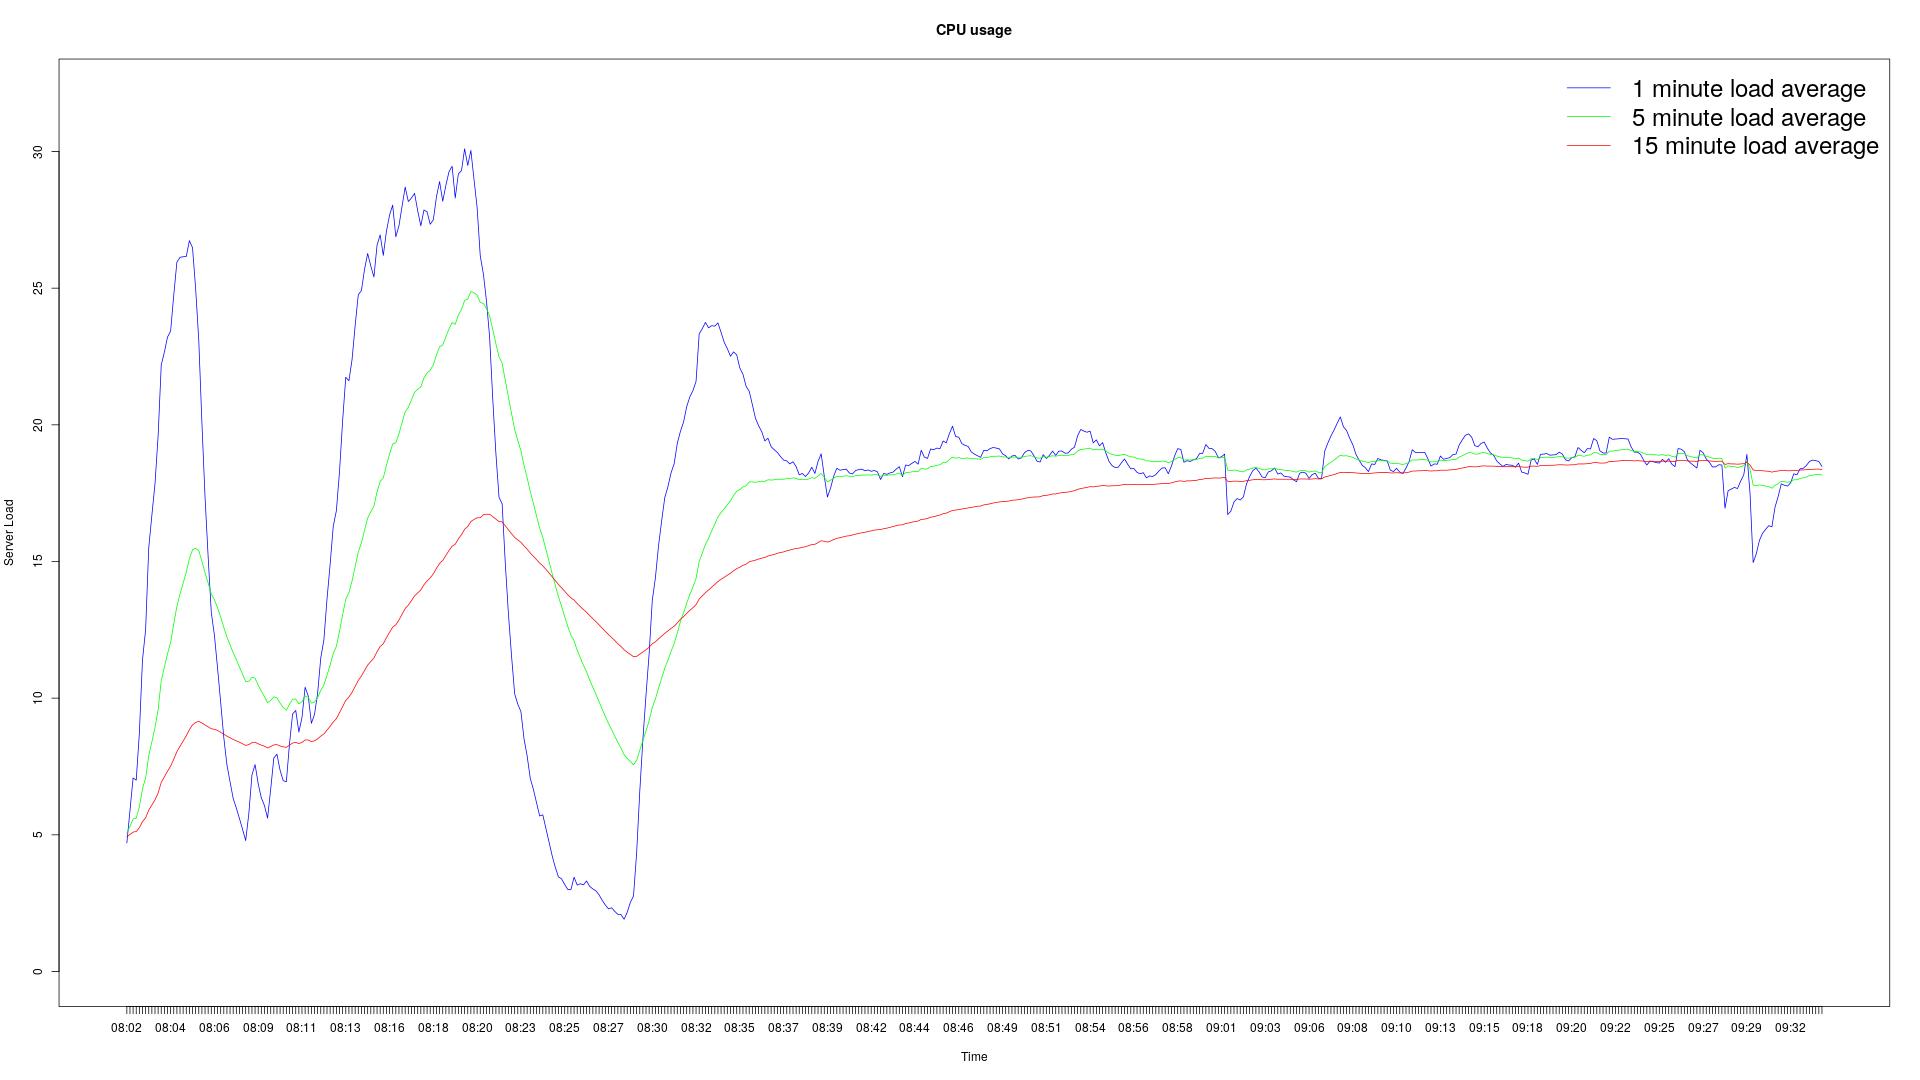
Sample CPU usage graph
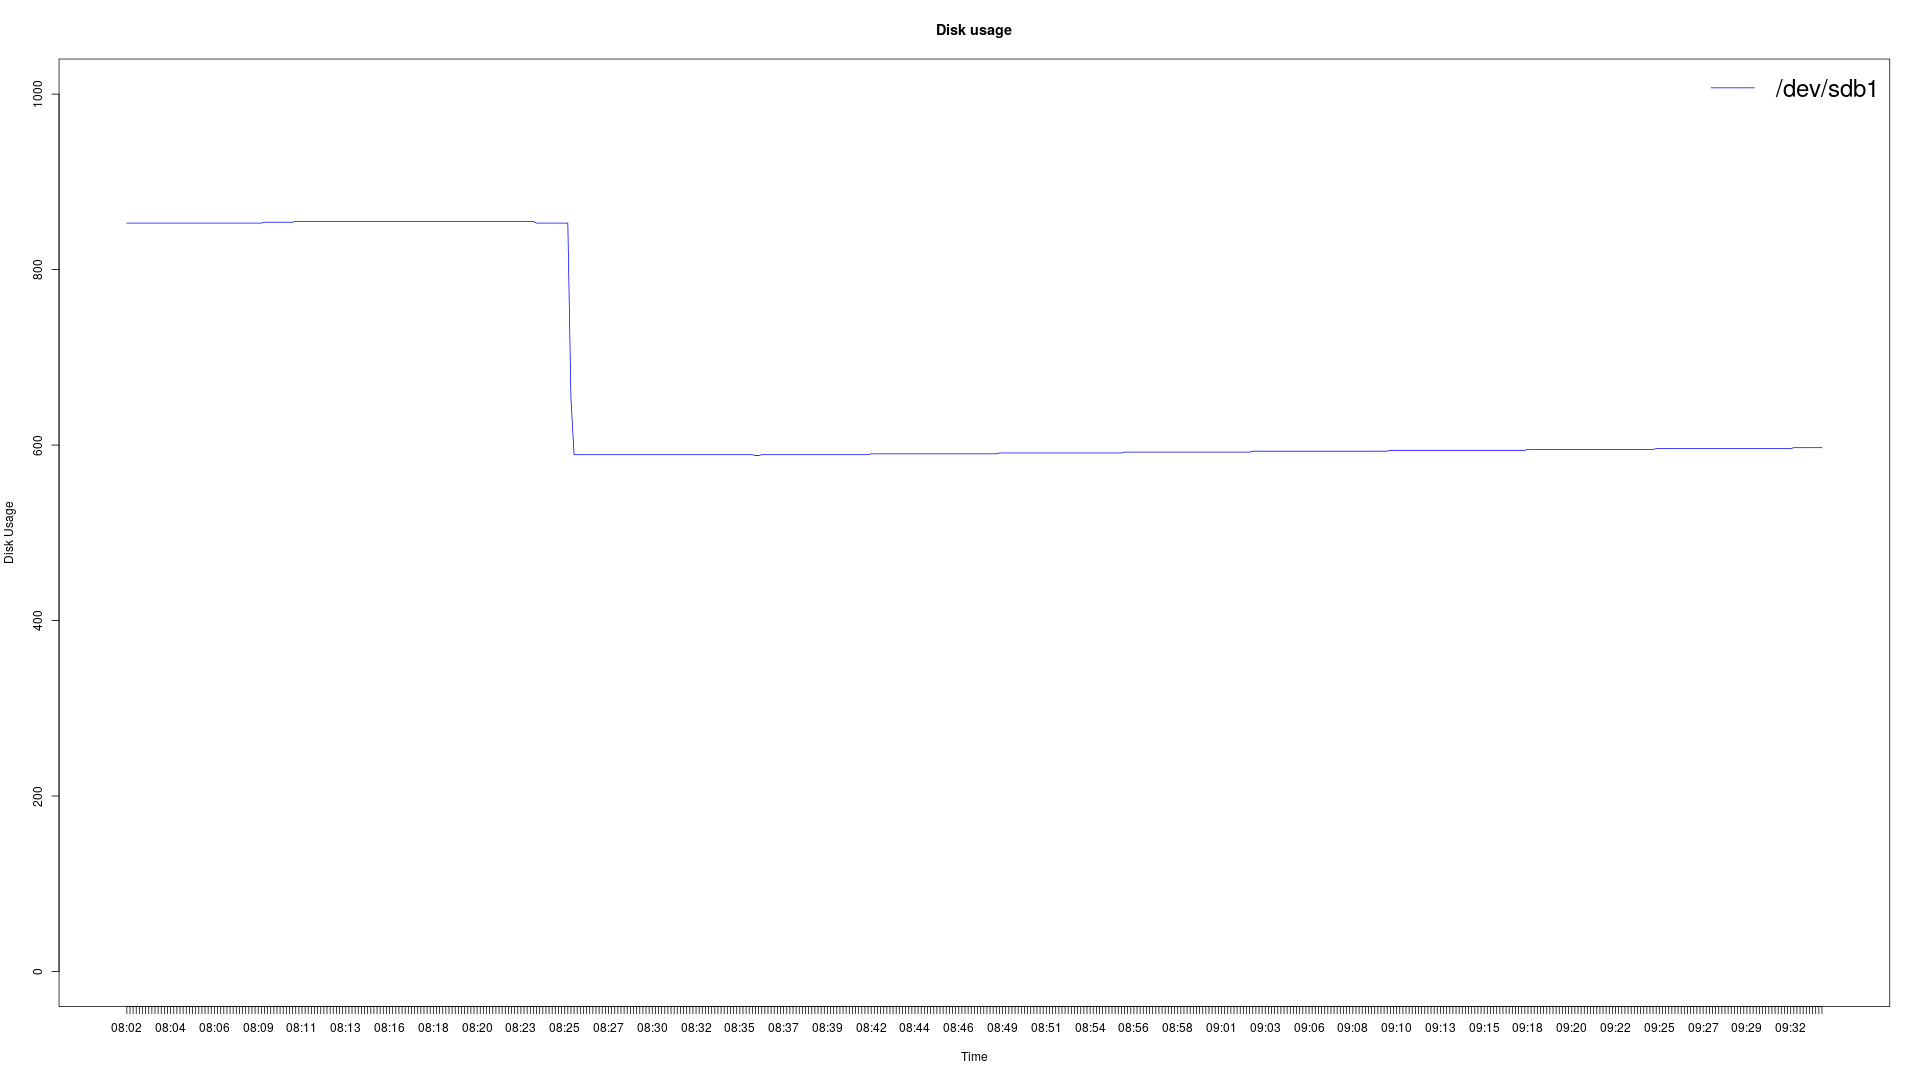
Sample disk usage graph
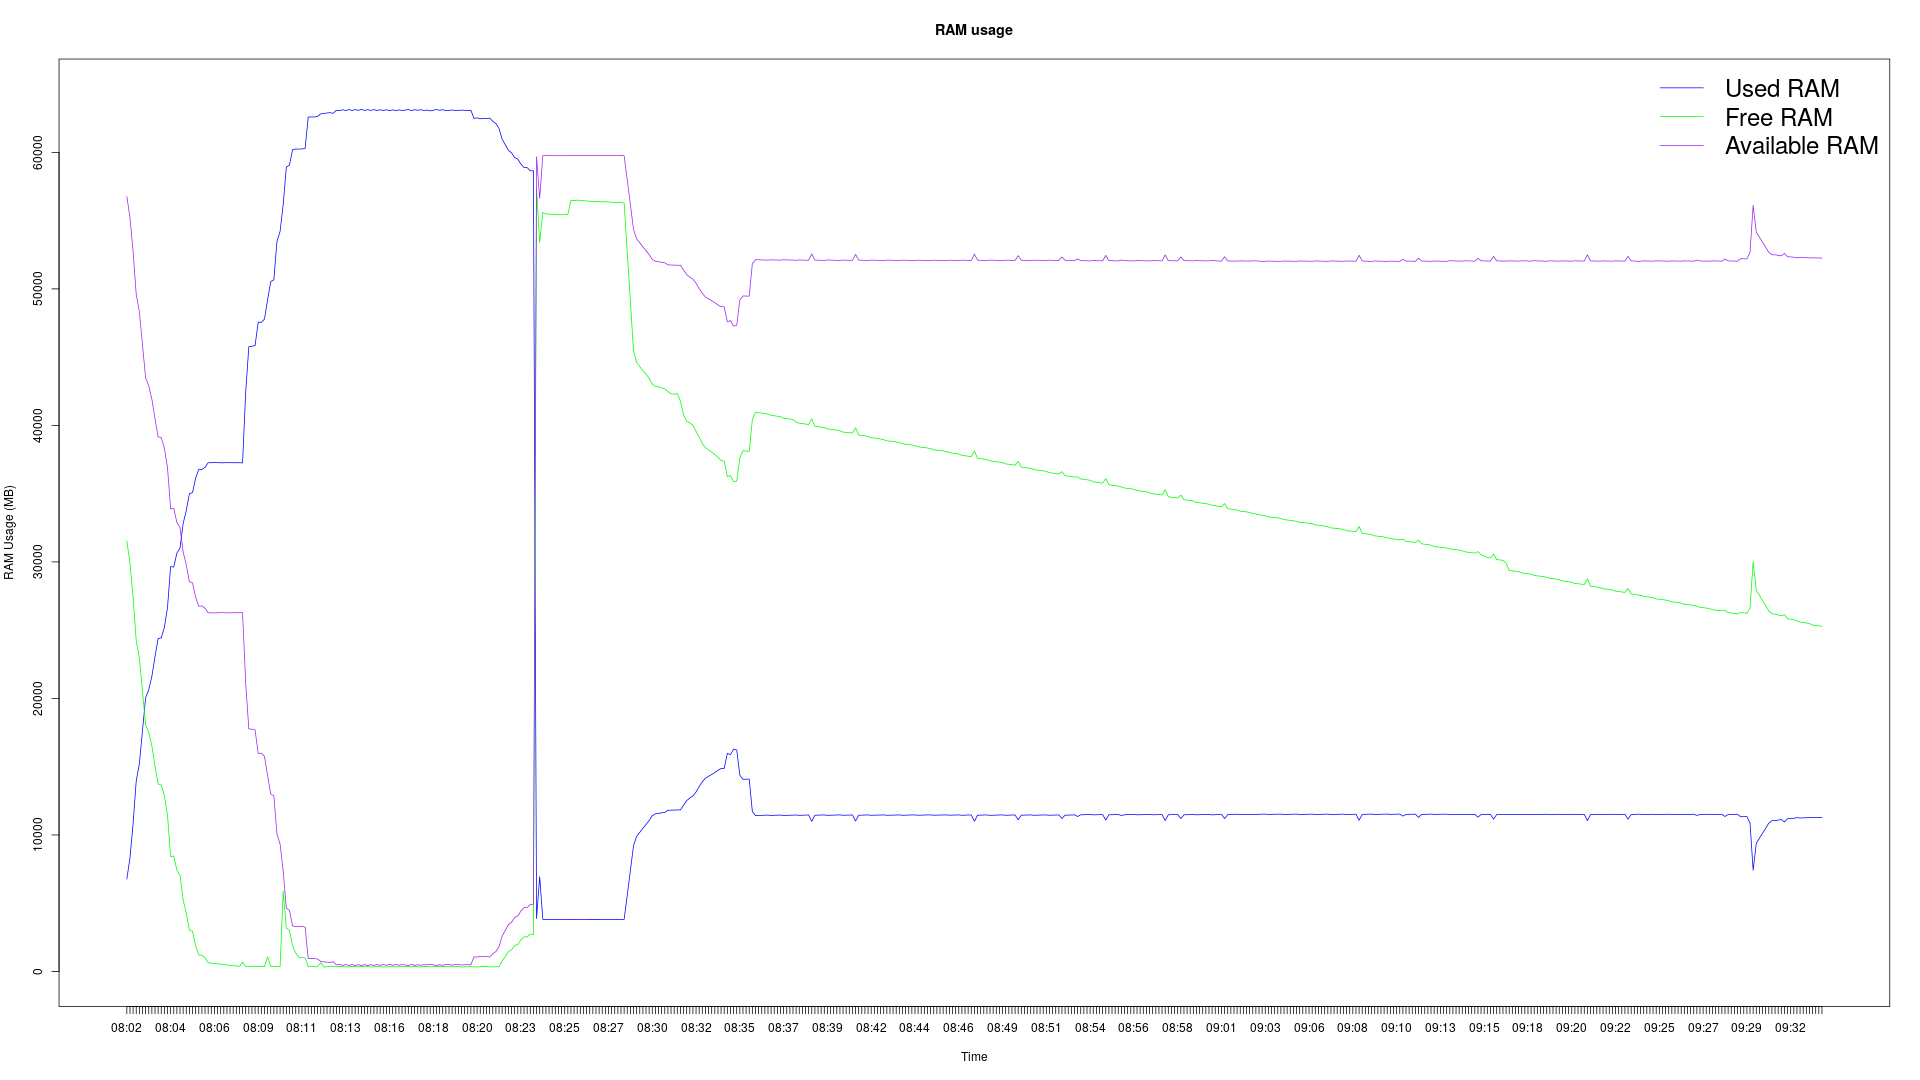
Sample RAM usage graph
Docker
N.B: It is currently hardcoded to check /dev/sda2, you need to manually edit the anacrontab file and rebuild the container if you want to check a different disk.
Run ./start-docker.sh to run everything in a docker container. Here's the line that gets executed: docker run --name serverload -d -v /tmp:/tmp --restart unless-stopped oskarv/serverload, you will be able to interact with it using e.g docker inspect serverload instead of the container id.
/tmp on the host is mounted on /tmp in the container, so the output files are available on the host by default.
The container will restart unless it is explicitly stopped.
When you run ./get-graphs.sh /tmp/mylogfile-date the png files are saved in the /tmp directory. Everything is owned by the host user since the serverload.sh script runs chmod 644 and chown 1000:1000 on /tmp/mylogfile*.
Manual usage - This has not beed tested since I made the docker container version, this may not actually work, ymmv
Run ./serverload.sh /dev/sda2 5 (or whatever partition you want to monitor and whatever time interval you want) to start monitoring the system resource usage. An output file named mylogfile-and-a-long-date will get created in /tmp.
To create the graph, run ./get-graphs /tmp/mylogfile-and-a-long-date.
Behind the scenes the get-graphs.sh script will begin by verifying that the syntax is correct with a regular expression,
it's an experiment, maybe it's not necessary, I don't know, just uncomment it if it's buggy.
Anyhow, then it runs
docker run --rm -ti -u $(id -u $USER):$(id -g $USER) -v /tmp:/tmp -v $(pwd):/script r-base Rscript /script/systemLoad.R $1
If you don't already have the r-base docker image it will get downloaded automatically when the script runs.
Output files named DiskUsage.png, RAM-Usage.png and SystemLoad.png will get created in /tmp.
If you're running Ubuntu you can run eog /tmp/SystemLoad.png to view the system load graph.
Not recommended but possible usage - This may also not work since I adapted it for docker usage, ymmv
You can make this into an anacron job by first moving the serverload.sh script to /usr/local/bin,
then run sudo nano /etc/anacrontab, and add this line: @daily 5 systemload /bin/bash serverload.sh /dev/sdb2 30
This will start the script at boot and then either restart it every 24 hours or start it again the next time you boot.
You should also move the get-graphs.sh and systemLoad.R scripts to /usr/local/bin, but this is hacky and you probably shouldn't actually do it. You have been warned.
If I haven't made it clear yet, the serverload.sh script is a severe hack, it works so far, but it's not pretty.