Py DS_Engineer Lab Report #06
I split the datasets into 85% training and 15% testing and ran the linear regression, optimization using tensorflow in python.
There is still a lot of noise in the data so the Absolute Mean Square Difference between training and testing is still high. Some ways to improve is to retrain the data and adjust based on the testing result so the accuracy can be improved. From training and testing plot, we can see that the data is improving (Error is less than the raw data) but still not good enough. There is definitely more training to be done!


DATASET : tshirt-H.csv

A small dataset ( 23 people ) with their names, heights and weights is used in this case. For siplicity on clustering a fairly small dataset, one iteration of K-mean Clustering was simutated throughout the process into 4 Clusters. The labeling will be assigned back to the data so each person will know what size of the T-shirt they're having! And for the company, they'll be able to determine the quantity and size range based on customers' weights and heights.
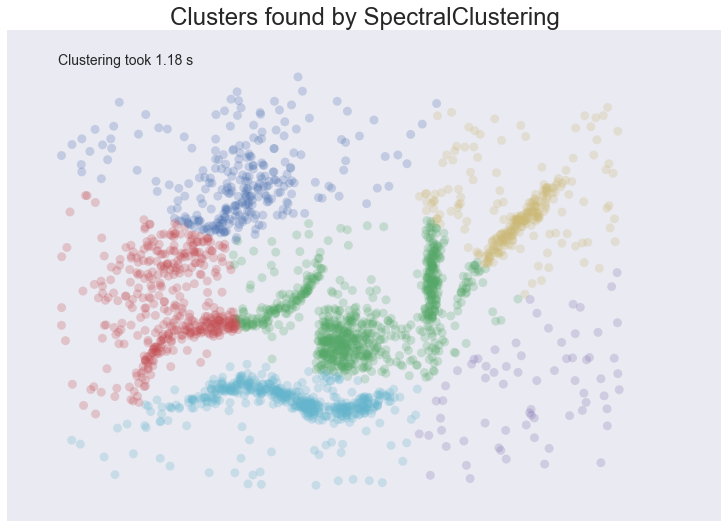
For spatial data, a graph formed by distances of points will be induced.The Spectral Clustering will then look at eigenvectors of the Laplacian of the graph to attempt to find a good (low dimensional) embedding of the graph into Euclidean space.
This technique is to find a transfornation of the graph to present manifold thathe the data is assumed to land on.
* Intuitive Parameters : Clustering number must be specifyour or hopefully find a 'suitabele' one through a range of parameters.
source: https://www.centerspace.net/clustering-analysis-part-iii-hierarchical-cluster-analysis
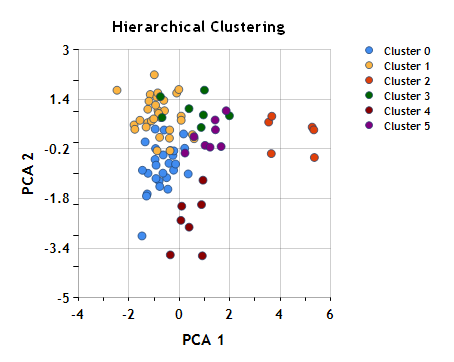
Build nested clusters by splitting or merging them successively. This algorithm is usually represented as a tree or dendrogram.
--- 1. Agglomerative - A "bottom up" approach, each observation starts in its own cluster and pairs of clusters are merged as one moves up the hierarchy.